Over the past three seasons, 210 teams have participated in bowl games.
47 of those teams had losing records in the years immediately preceding
their bowl game. This semi-regular piece will showcase the losers from
2013 who just might find themselves participating in Capital One Bowl
Week in 2014. The tenth team we will examine is the Northwestern Wildcats.
Northwestern:
2013 Record: 5-7 (1-7 Big 10)
Summary: Fresh off their
first bowl win since
1948, Northwestern began the 2013 season 4-0 and climbed to number sixteen in the polls. In early October, they hosted Ohio State (Gameday was there) and the Wildcats lost a back-and-forth battle to the Buckeyes that was much closer than the
misleading final score. The Wildcats followed up that loss with a blowout at the hands of the Wisconsin Badgers. Sitting at 0-2 in the Big 10, their conference title hopes were effectively kaput, but the Wildcats still had a great shot getting to eight or nine regular season wins. Over the next four games, Northwestern would suffer heart break after heart break. First, they lost by three to Minnesota. Then they fell in overtime to Iowa. Then just when it looked like they were about to upset Nebraska in Lincoln, this happened:
After a bye week, Northwestern hosted Michigan and nearly had the Wolverines beat until a hectic field goal forced overtime. The game would last three overtimes before the Wildcats were once again vanquished, extending their losing streak to six. There would be no bad breaks the following Saturday when Michigan State pummeled the Wildcats. Playing for pride in their final game, the Wildcats managed to finally eke out a close win, beating Illinois by three to finish 5-7.
What Did the Wildcats Do Well?
Score in the red zone. While the Wildcats featured one of the worst offenses in their recent vintage, they at least did a solid job of scoring once they got into the
Red Zone. Only two teams, Florida State and Boston College, scored on a larger percentage of their red zone drives. However, while the Wildcats only failed to score on red zone trip twice all season, their scores were disproportionately field goals. 20 of their 46 red zone trips resulted in successful field goals. At over 43%, the Wildcats had the highest red zone field goal scoring rate of any team in the country. Leaving all those extra points on the field probably had a great deal to do with their 1-4 mark in one-score games.
What Didn't the Wildcats Do Well?
Score. Northwestern averaged 26.2 points per game in 2013. While this number compares favorably to their scoring averages in 2008 (24.4), 2009 (25.9), and 2010 (26.4), during which time they managed a cumulative 24-15 mark (13-11 in the Big 10), it is a bit deceiving. In their four non-conference games, the Wildcats averaged 41.3 points per game. Once conference play began, their scoring margin dipped to 18.6 points per game. After scoring 30 in their conference opener against Ohio State, the Wildcats averaged just 17 points per game through the rest of Big 10 play (13.7 points against teams not named Illinois). Bookending Big 10 play against Ohio State and Illinois, the Wildcats scored seven offensive touchdowns. In their other six league games, they also scored seven offensive touchdowns.
The Wildcats Over the Past Four Years:
The following table lists Northwestern's performance (in conference play only)
in a few key categories and their respective conference rank in those
categories. To help you read the table here is a handy translator.
Conf: The Conference Northwestern played in. With the ever-changing college football landscape, this is helpful.
Coach: Who was leading these yahoos into battle?
Rec: Conference Record
YPP: Yards per play. The number of yards per play the Wildcats averaged in conference play.
YPA: Yards per play allowed. The number of yards per play the Wildcats allowed in conference play.
Net: Yards per play net. The difference in YPP and YPA. Higher is better.
OTD: Offensive touchdowns. Touchdowns scored by the offense (no
kick, punt, interception, or other returns are counted) in conference
play.
DTD: Defensive touchdowns. Touchdowns allowed by the defense (no
kick, punt, interception, or other returns are counted) in conference
play.
Pythag: Adjusted Pythagorean Record. Take offensive touchdowns
and defensive touchdowns and plug them into a handy formula to estimate
the number of conference wins. For a full rundown of the APR,
continue reading here.

Notice anything about the final yards per play numbers from Northwestern? In 2010, 2011, and 2013, the Wildcats pretty much fielded the same team on a per play basis. Sure, the offense was stronger in both 2010 and 2011 than 2013, while the defense was stronger in 2013, but the overall performance was about the same. The difference between being 3-5 in the Big 10 and 1-7 in the Big 10 was pretty much close game randomness. The Wildcats were 3-2 in one-score conference games in 2010. They were 1-1 in such games in 2011. In 2013, they were 1-4. For those of you mathematics types out there, that means the Wildcats were 0-3 in conference games decided by more than a touchdown in 2010, 2-4 in such games in 2011, and 0-3 in 2013. A break here or there in 2013, and Northwestern's bowl streak is going strong at six. Other interesting Wildcat factoids? While Northwestern has hardly truly contended for a Big 10 title over the past four seasons, they have won 28 games, and played in the postseason thrice despite producing just two draft picks in that span. Who were those esteemed gentlemen you may ask? Tight end
Drake Dunsmore and wide receiver
Jeremy Ebert, who were both selected in the seventh round in 2012. In the meritocracy of college football, you don't get extra credit for doing more with less, but it should be noted that Illinois has had twelve players drafted (including a
trio of
first rounders) and has but a scant seven Big 10 wins in that span (compared to twelve Big 10 wins for the Wildcats).
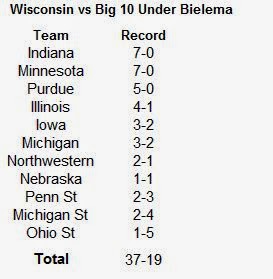
The 2014 Schedule:
The 2014 non-conference schedule has its share of
pitfalls for the Wildcats. Northwestern opens the 2014 season by hosting Cal. Last season the Wildcats beat Cal in Berkley by two touchdowns. However, the Golden Bears will be in their second season under
Sonny Dykes and should improve on their 1-11 mark last season. The Wildcats then host Northern Illinois, a strong mid-major team with a 46-10 record over the past four seasons. The Huskies will certainly miss Heisman trophy finalist
Jordan Lynch, but this game will be much more challenging than facing a low-level team from the Sun Belt. Northwestern's third non-conference foe is Western Illinois. The
Leathernecks, despite their imposing nickname, are a IAA school and should move Northwestern one win closer to bowl eligibility. The Wildcats play their final non-conference game late in the season when they travel to South Bend to face the Fighting Irish. Notre Dame and Northwestern have not played since the
magical 1995 season. Northwestern will probably need a little more magic to beat the Irish on their home field. Realistically, a sweep of all four non-conference games is unlikely. Grounded Northwestern fans should be content with a 3-1 mark in non-conference action. Once conference play begins, the Wildcats,will host Illinois, Michigan, Nebraska, and Wisconsin. While the Wildcats will likely be underdogs in three of those games (all but Illinois), they have played Michigan and Nebraska tight in recent seasons. While they are just 1-5 against the Wolverines and Cornhuskers since 2011, four of their five losses have come by a touchdown or less. At worst, the Wildcats should split their home conference games. Their road Big 10 games come against Iowa, Minnesota, Penn State, and Purdue. Once again, Northwestern will likely only be favored in one of these games (Purdue), but the other three are hardly lost causes. Three league wins should be the floor for this team, and with the right maturation and a few breaks, the Wildcats could win more than they lose in conference play.
Reason for Optimism:
Track record and luck. Prior to 2013, the Northwestern Wildcats had been bowl eligible for six consecutive seasons (they missed out despite six wins in
2007). The worst
SRS score they have compiled since 2007 is -3.70, meaning they would be an underdog by a little more than a field goal on a neutral field against an average college football team. In fact, their SRS in 2013 was 3.97, the third highest of the
Pat Fitzgerald era. With a little better luck, and a better job of finishing drives, the Wildcats can return to the postseason in 2014. That being said, how likely are the Wildcats to do a better job of finishing drives? Read on!
Final Prognosis:
As mentioned earlier, the Wildcats led the nation by having over 43% of their red zone drives end in field goals. Since 2008, seven teams in addition to Northwestern have seen more than forty percent of their red zone drives end in successful field goals. They are listed below, along with their scoring averages for the year in question, and their scoring averages the following season.

What does this portend for Northwestern? Well, the picture is a little muddy. Four of the seven teams improved their scoring average the following season and three saw their average decline. However, most of the losses and gains were relatively miniscule. Only Virginia in 2009-2010 and Colorado State in 2010-2011 saw their averages climb significantly. The good news for Northwestern fans is they are unlikely to see a significant decline in their scoring averages. 26 points, even in today's environment, will win you some games. The schedule is somewhat daunting with just a single layup on paper, but the Wildcats have been a consistent winner over the last decade. Look for the Wildcats to be back in the postseason and who knows, perhaps they can run their bowl win streak to two.