Wednesday, February 22, 2017

2016 Yards Per Play: Big 12

Three conferences down, seven to go. Our sojourn through the 2016 season takes us to the Big 12. Here are the Big 12 standings.
So we know what each team achieved, but how did they perform? To answer that, here are the Yards Per Play (YPP), Yards Per Play Allowed (YPA) and Net Yards Per Play (Net) numbers for each Big 12 team. This includes conference play only. The teams are sorted by Net YPP with conference rank in parentheses.
College football teams play either eight or nine conference games. Consequently, their record in such a small sample may not be indicative of their quality of play. A few fortuitous bounces here or there can be the difference between another ho-hum campaign or a special season. Randomness and other factors outside of our perception play a role in determining the standings. It would be fantastic if college football teams played 100 or even 1000 games. Then we could have a better idea about which teams were really the best. Alas, players would miss too much class time, their bodies would be battered beyond recognition, and I would never leave the couch. As it is, we have to make do with the handful of games teams do play. In those games, we can learn a lot from a team’s YPP. Since 2005, I have collected YPP data for every conference. I use conference games only because teams play such divergent non-conference schedules and the teams within a conference tend to be of similar quality. By running a regression analysis between a team’s Net YPP (the difference between their Yards Per Play and Yards Per Play Allowed) and their conference winning percentage, we can see if Net YPP is a decent predictor of a team’s record. Spoiler alert. It is. For the statistically inclined, the correlation coefficient between a team’s Net YPP in conference play and their conference record is around .66. Since Net YPP is a solid predictor of a team’s conference record, we can use it to identify which teams had a significant disparity between their conference record as predicted by Net YPP and their actual conference record. I used a difference of .200 between predicted and actual winning percentage as the threshold for ‘significant’. Why .200? It is a little arbitrary, but .200 corresponds to a difference of 1.6 games over an eight game conference schedule and 1.8 games over a nine game one. Over or under-performing by more than a game and a half in a small sample seems significant to me. In the 2016 season, which teams in the Big 12 met this threshold? Here are the Big 12 teams sorted by performance over what would be expected from their Net YPP numbers.
Kansas State significantly exceeded their expected record based on their YPP numbers and Iowa State missed out on a few wins. For Kansas State, this has become a yearly refrain. Bill Snyder appears to have hacked football. His teams always seem to have winning records in close games (3-2 in one-score conference games this year), win the turnover battle (+7 in-conference turnover margin was tops in the Big 12), and score in unconventional ways (net +4 in non-offensive touchdowns in conference play was also the best in the Big 12). The Wildcats' win against Texas Tech was particularly telling about doing the little things to win. Texas Tech outgained Kansas State by over 250 yards and averaged nearly a yard more per play than the Wildcats. However, Kansas State did not turn the ball over and managed to capitalize on the one big mistake the Texas Tech offense made by returning an interception for a touchdown. The Wildcats also returned a kickoff for a touchdown in a game they won by six points. In addition, Kansas State used their ball control offense to limit the possessions in each game and make the outcome more variable, which favors less talented teams. The Wildcats ran and faced the fewest plays in Big 12 action in 2016. Their games saw about eleven fewer plays than the average Big 12 game in 2016, making giving each play and possession in a Kansas State game more high leverage than a typical Big 12 game. On the other end of the spectrum, Iowa State can lay some of blame for their underachievement on close game randomness (1-3 in one-score conference games), but I think the real culprit is their season-long total is boosted by one great game. The Cyclones hosted Texas Tech in the penultimate game of the regular season and hammered the Red Raiders. Iowa State averaged nearly five yards more per play (9.35 to 4.43 than the Red Raiders) and beat them by more than 50 points. That fine performance bodes well for Iowa State heading into 2017, but it also served to skew their numbers in 2016.

In late-September, Baylor hosted Oklahoma State in the conference opener for both teams. Oklahoma State was unranked and just two weeks removed from a massive home upset at the hands of Central Michigan (and the officials). Baylor was ranked in the top-20 after breezing through the non-conference portion of their schedule. Baylor was about a touchdown favorite and won by eleven points. At the time, the result did not seem out of place with what was expected of both teams going into the game. However, looking back on that game with a season’s worth of data, the result is somewhat surprising. After the win, Baylor lost six of their final eight regular season games and finished just 3-6 in Big 12 play. Meanwhile, Oklahoma State won seven in a row after losing to the Bears and finished with a 7-2 conference record. Removing the game they played against each other, Oklahoma State finished five games better than Baylor in Big 12 play (7-1 versus 2-6). With this interesting statistical tidbit in mind, I decided to look at all instances since 2011 of a BCS/Power 5 team beating a conference opponent despite being at least five games worse than them in the standings when removing the game in question. The results are summarized by year in the table below with Big 12 results highlighted.
The Big 12 has incurred six instances of teams winning a game despite being at least five games worse than their opponent in the standings. Some of this is a pure numbers game. The Big 12 and Pac-12 have played nine conference games since 2011, and it is easier to finish five games or more behind a conference opponent when you play an additional game. The ACC and SEC play eight conference games and the Big 10 played eight before 2016. With that in mind, it is not surprising that the Big 12 leads the way with six and the Pac-12 is second with four. Still, the losses Big 12 teams have endured have had a profound impact on the national championship picture. Consider:

In 2011, Oklahoma State’s loss to Iowa State assuredly cost them a chance to face LSU in the BCS National Championship Game.

In 2012, Kansas State’s loss to Baylor almost certainly cost them a chance to play Notre Dame in the BCS National Championship Game.

In 2013, Oklahoma State’s loss to West Virginia prevented the Cowboys from playing host to Oklahoma with a potential spot in the final BCS National Championship Game on the line. The Cowboys entered the game with the Sooners ranked sixth in the country on Championship Saturday. Had they not lost to West Virginia, they would have been unbeaten and probably ranked third behind Ohio State. The Cowboys lost that game and with it, the Big 12 championship to Oklahoma, but had they not lost to West Virginia, the hype surrounding Bedlam would have been amazing.

In 2015, Oklahoma lost to Texas in the Red River Rivalry and very nearly cost them a spot in the second College Football Playoff.

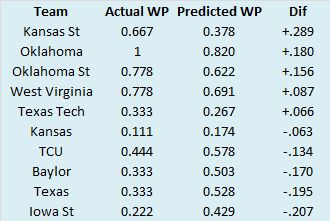
It will probably come as no surprise that only one of these sixteen instances happened at the home of the team with the better record. That would be Texas Tech breaking Oklahoma’s 39-game home streak in 2011. The 2015 Oklahoma/Texas game was at a neutral site, but all the others came on the road. Oklahoma State/Baylor was the only game where the team that ended with the far superior conference record was an underdog. Obviously, it was early enough in the season for the oddsmakers and public to not have a good grasp on how good these teams would be. In 2017, which team(s) will suffer a massive upset at the hands of a conference opponent despite owning a vastly superior record? While we can’t say who it will be, there is a good chance the team(s) will come from the Big 10, Big 12, or Pac-12.

Wednesday, February 15, 2017

2016 Adjusted Pythagorean Record: Big 10

Last week, we looked at how Big 10 teams fared in terms of yards per play. This week, we turn our attention to how the season played out in terms of the Adjusted Pythagorean Record, or APR. For an in-depth look at APR, click here. If you didn’t feel like clicking, here is the Reader’s Digest version. APR looks at how well a team scores and prevents touchdowns. Non-offensive touchdowns, field goals, extra points, and safeties are excluded. The ratio of offensive touchdowns to touchdowns allowed is converted into a winning percentage. Pretty simple actually.

Once again, here are the 2016 Big 10 standings.
And here are the APR standings sorted by division with conference rank in offensive touchdowns, touchdowns allowed, and APR in parentheses. This includes conference games only with the championship game excluded.
Finally, the Big 10 teams are sorted by the difference between their actual number of wins and their expected number of wins according to APR.
I use a game and a half as a line of demarcation to determine if teams drastically over or under perform their APR. By that standard, Michigan and Michigan State underperformed based on the touchdowns they scored and allowed while Nebraska fared better than the numbers suggested they should. Michigan State and Nebraska also boasted records that differed from their expected records based on YPP and we discussed the potential reasons for that last week. So, we’ll move on to Michigan, a team with the highest APR in the Big 10. How did the Wolverines win fewer games than would be expected based on their touchdowns scored and allowed? For starters, the Wolverines' two losses came in games during which they never trailed with time on the clock. Iowa beat then on a field goal at the gun and Ohio State famously edged them in double overtime. Plus, in the loss to Buckeyes, one of Ohio State’s scores came via an interception return, something that is not considered in the APR. In their seven conference wins, Michigan was typically dominant. Five of their seven victories came by double-digits with four coming by more than 30 points. Michigan was the most dominant Big 10 team in 2016, and arguably the best. However, they were done in by a pair of close road losses. If a few more plays in those games had gone their way, the Wolverines could have earned a berth in the College Football Playoff. As it is, they had to settle for an Orange Bowl bid.

When college football historians look back on the 10’s decade of the 2000’s, along with the unveiling of the college football playoff and the legitimate paying of players, the most discussed phenomenon will probably be conference expansion and realignment. Beginning with the 2011 season, at least one conference from the quartet of the ACC, Big 10, Pac-12, and SEC added a new member each of the next four seasons. The ripple effects across the rest of college football were deep and wide and their impacts are not yet fully known. As conferences expand, it seems there would be diminishing returns with each new member. If these teams were really that great, they would already be in these superior leagues right? Superior may mean better at football or simply more stable thanks to better television contracts in this case. Three Power 5 conferences (ACC, Big 10, and SEC) currently house 14 teams. These are the only Power 5 conferences with more than 12 members. How have the most recent additions (i.e., the ones after 12 for which we might expect diminishing returns) fared since joining their respective leagues? With a handful of seasons in the books could a conference have buyer’s remorse? While expansion has a variety of different drivers including television markets, recruiting grounds, and academic reputations, the focus of this blog has always been results on the field. With that in mind, the following table summarizes the gridiron accomplishments of the most recent additions. The distinctions between the three leagues are pretty stark and there is a clear gold/silver/bronze pecking order that has been established thus far.
While Missouri and Texas A&M have only managed a combined 40-40 conference record since joining the SEC, that number has been dragged down by Missouri’s 3-13 SEC mark over the past two seasons. The Tigers and Aggies own the only top-ten finishes of any team in this cohort and also have four top-25 finishes between them. Plus, despite their reputation as underachievers, Texas A&M has not finished outside the top 30 of the SRS since joining the SEC. Over in the ACC, Louisville and Pittsburgh have been welcome additions to the conference with the pair posting a combined 35-21 conference record. You can do the math and see that Syracuse has not pulled their weight, especially considering they actually tied for the Big East championship (granted it was a four-way tie) in their last season in the conference. The team from upstate New York has been particularly dreadful over the past three seasons, posting a 5- 19 conference record and averaging an 85th place finish in the SRS. As poor as Syracuse has played, the combination of Maryland and Rutgers has been nearly as bad. Neither team has posted a winning conference record since joining the Big 10, with Maryland’s 4-4 record in 2014 representing the high-water mark. Rutgers has won exactly one conference game over the past two seasons and neither the Terrapins nor the Knights have finished higher than 50th in the SRS since joining the league. Fortunes could be changing with Maryland’s recent recruiting renaissance and perhaps Rutgers has delivered the coveted New York City market, but thus far, the on the field exploits of Maryland and Rutgers have not been up to Big 10 standards.

Wednesday, February 08, 2017

2016 Yards Per Play: Big 10

Two conferences down, eight to go. We now head to the Midwest and the Big 10. Here are the Big 10 standings.
So we know what each team achieved, but how did they perform? To answer that, here are the Yards Per Play (YPP), Yards Per Play Allowed (YPA) and Net Yards Per Play (Net) numbers for each Big 10 team. This includes conference play only, with the championship game not included. The teams are sorted by division by Net YPP with conference rank in parentheses.
College football teams play either eight or nine conference games. Consequently, their record in such a small sample may not be indicative of their quality of play. A few fortuitous bounces here or there can be the difference between another ho-hum campaign or a special season. Randomness and other factors outside of our perception play a role in determining the standings. It would be fantastic if college football teams played 100 or even 1000 games. Then we could have a better idea about which teams were really the best. Alas, players would miss too much class time, their bodies would be battered beyond recognition, and I would never leave the couch. As it is, we have to make do with the handful of games teams do play. In those games, we can learn a lot from a team’s YPP. Since 2005, I have collected YPP data for every conference. I use conference games only because teams play such divergent non-conference schedules and the teams within a conference tend to be of similar quality. By running a regression analysis between a team’s Net YPP (the difference between their Yards Per Play and Yards Per Play Allowed) and their conference winning percentage, we can see if Net YPP is a decent predictor of a team’s record. Spoiler alert. It is. For the statistically inclined, the correlation coefficient between a team’s Net YPP in conference play and their conference record is around .66. Since Net YPP is a solid predictor of a team’s conference record, we can use it to identify which teams had a significant disparity between their conference record as predicted by Net YPP and their actual conference record. I used a difference of .200 between predicted and actual winning percentage as the threshold for ‘significant’. Why .200? It is a little arbitrary, but .200 corresponds to a difference of 1.6 games over an eight game conference schedule and 1.8 games over a nine game one. Over or under-performing by more than a game and a half in a small sample seems significant to me. In the 2016 season, which teams in the Big 10 met this threshold? Here are the Big 10 teams sorted by performance over what would be expected from their Net YPP numbers.
Illinois and Michigan State significantly underperformed their expected records based on their YPP numbers while Nebraska far exceeded their middling peripherals. For Michigan State, the culprit is pretty simple. The Spartans were 0-3 in one-score conference games (and really 0-4 as their final margin against Michigan was a bit misleading after Jabrill Peppers returned a two-point conversion attempt for a score). In addition, the Spartans won their only conference game (albeit against Rutgers) in dominant fashion. We’ll come back to Michigan State in a bit. For Illinois, their case is a bit harder to crack. The Illini were not especially poor in close games (1-1 record) nor did they have a particularly dreadful turnover margin (-3 in conference play). The culprit appears to be their inefficient passing attack. In their final seven conference games, Illinois managed to complete just 44% of their passes! In the modern college game, that is simply unfathomable for a non-option offense to play that poorly. Even with a decent running game, the lack of any semblance of a passing offense confined the Illini to a 2-7 record despite poor, but not horrendous peripherals. How did Nebraska post such a great conference record despite numbers that suggested they should have lost more conference games than they won? The Cornhuskers were only 2-1 in one-score conference games, so we’ll have to look elsewhere. The answer lies in two of their defeats. While Nebraska was solid in most of their games, they were awful in two of their three conference losses. Ohio State and Iowa beat the Cornhuskers by a combined score of 102-13, and the per play numbers were also brutal. Those two losses more than wiped out the margin of victory in their six conference wins (outscored those teams by 72 points). Nebraska was good, but not dominant in most of their wins, and they played like Rutgers in two of their three losses.

Michigan State was one of the most disappointing teams in 2016. The Spartans, fresh off a Big 10 title and playoff appearance, began the year in the top 15 of the AP Poll, but won just a single conference game and finished 3-9 overall. However, while their won/loss record was abysmal, their actual play was mediocre. Based on their YPP numbers, a team with Michigan State’s profile would have been expected to win about four of their nine conference games. That would have put them at about 6-6 on the year. That record is hardly cause for celebration, but it would have been quite similar to their 2012 campaign when they reset after multiple years competing for conference titles. As you may have noticed in the table regarding differences between predicted record and actual record, Michigan State undershot their projection by a significant margin. I use .200 as the arbitrary threshold of significance, but Michigan State missed out on their projection by nearly double that margin! Since I have calculated YPP data back through 2005, I decided to look at teams that had similar exaggerated discrepancies between their expected record based on YPP and their actual record. For this study, I looked at BCS/Power 5 teams that undershot their YPP projection by at least .300. Those parameters yielded fifteen BCS/Power 5 teams from 2005-2015 (and three teams from 2016, including Michigan State, Arizona, and UCLA). I then looked at how those teams performed the following season. Well, what can Michigan State expect in 2017? Take a look at the following table that summarizes the results.
In a not shocking at all development, these teams tend to improve the next season. The fifteen teams improved by an aggregate total of 33.5 games in conference play the following season (2.23 per team). Eleven of the fifteen teams improved by at least one game, with some teams making tremendous leaps (four teams saw their conference win total improve by at least four games). Four teams saw their win totals remain the same and only one team declined. Even though Michigan, Ohio State, and Penn State occupy the same division as the Spartans, there is a high probability that the team will rebound in 2017. In fact, it would basically take the coaching prowess of Ron Zook for Michigan State not to be better in 2017.

Wednesday, February 01, 2017

2016 Adjusted Pythagorean Record: ACC

Last week, we looked at how ACC teams fared in terms of yards per play. This week, we turn our attention to how the season played out in terms of the Adjusted Pythagorean Record, or APR. For an in-depth look at APR, click here. If you didn’t feel like clicking, here is the Reader’s Digest version. APR looks at how well a team scores and prevents touchdowns. Non-offensive touchdowns, field goals, extra points, and safeties are excluded. The ratio of offensive touchdowns to touchdowns allowed is converted into a winning percentage. Pretty simple actually.

Once again, here are the 2016 ACC standings.
And here are the APR standings sorted by division with conference rank in offensive touchdowns, touchdowns allowed, and APR in parentheses. This includes conference games only with the championship game excluded.
Finally, ACC teams are sorted by the difference between their actual number of wins and their expected number of wins according to APR.
I use a game and a half as a line of demarcation to determine if teams drastically over or under perform their APR. By that standard, Wake Forest and Boston College were the only teams with actual records far removed from their APR. Neither team was particularly fortunate in close games, with the Deacons and Eagles combining for a 3-3 record in one-score conference games. The primary reason for the disconnect was the fact that Wake and BC lost their fair share of blowouts. Four of Wake Forest’s five conference losses came by double digits and Boston College lost four of their six league games by at least 38 points. In their games against Clemson, Florida State, Louisville, and Virginia Tech, the Eagles were outscored by a combined 178 points!

I love the option and by extension, I tend to root for teams that run the option or some variation of it. Consequently, I end up watching a lot of games that involve the service academies, Georgia Southern, New Mexico, Tulane, and the only Power 5 team that currently employs it – Georgia Tech. Since I watched a great deal of Georgia Tech games this year, I noticed the Yellow Jackets were pretty abysmal at rushing the passer. In fact, Georgia Tech accumulated just 18 sacks all year. They did get to the quarterback better late in the year as they notched ten sacks in their final four games. Still, 18 sacks ranked just 107th nationally, and when you consider that Georgia Tech had an extra game to pad their total, well the number looks even worse. Of course, Georgia Tech only allowed 16 sacks on the year, which was in the top 20 nationally, so they must have protected the quarterback pretty well right? Ah, but as I mentioned before, Georgia Tech runs the option which means they attempt among the fewest passes in the nation. In fact, they threw just 160 passes in 2016. Only three teams (all three service academies) attempted fewer. So, allowing 16 sacks is not nearly as impressive as the raw total might lead you to believe when adjusting for the number of pass attempts and considering that Georgia Tech often uses the forward pass to surprise opponents. Without running the numbers, Georgia Tech seemed to possess an historic inability to rush the passer and protect their own quarterback. In the interest of determining where they ranked in recent history, I decided to run the numbers. I looked at all Power 5 teams (and Notre Dame) over the last three seasons and calculated their Sack Rate and Sack Rate Allowed.

The Sack Rate is: Sacks/(Sacks + Opponent Pass Attempts) or Sacks/Opponent Drop Backs
The Sack Rate Allowed is: Sacks Allowed/(Sacks Allowed + Pass Attempts) or Sacks Allowed/Drop Backs
I multiplied both products by 100 and subtracted the Sack Rate Allowed from the Sack Rate to find the Net Sack Rate. Positive numbers mean teams sack their opponents more often per 100 drop backs while negative numbers mean the opposite. Were my suspicions correct? Where did Georgia Tech rank? Here are the bottom five Power 5 teams in Net Sack rate from the past three seasons.
As far as recent history goes, Georgia Tech was quite poor in 2016 at generating a pass rush and protecting their own quarterbacks on the rare occasions they attempted to pass. It is interesting that an awful Net Sack Rate does not necessarily correlate with a bad record. Georgia Tech finished 9-4 in 2016, while Maryland, South Carolina, and Vanderbilt all played in bowl games. It just goes to show that it is possible to win (at a moderate clip) despite being severely deficient at an important aspect of the game.