With the dissolution of the Pac-12, the Mountain West is the only conference with all members in the western half of the United States (
for now). How did things play out in 2024?
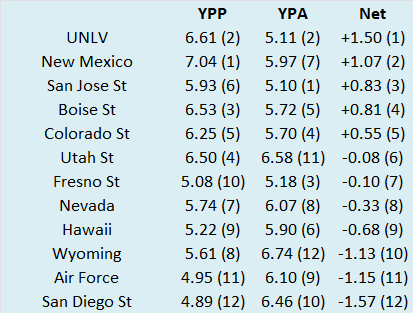
Here are the 2024 Mountain West standings.
So we know what each team achieved, but how did they perform? To answer that, here are the Yards Per Play (YPP), Yards Per Play Allowed (YPA) and Net Yards Per Play (Net) numbers for each Mountain West team. This includes conference play only, with the championship game not included. The teams are sorted by Net YPP with conference rank in parentheses.

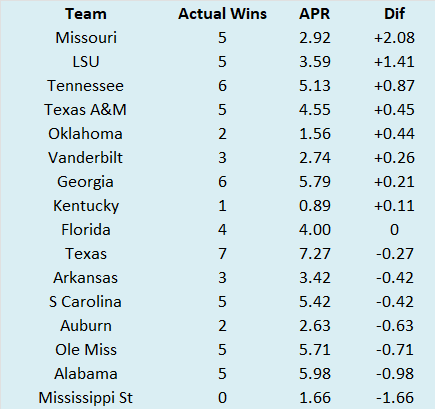
College football teams play either eight or nine conference games. Consequently, their record in such a small sample may not be indicative of their quality of play. A few fortuitous bounces here or there can be the difference between another ho-hum campaign or a special season. Randomness and other factors outside of our perception play a role in determining the standings. It would be fantastic if college football teams played 100 or even 1000 games. Then we could have a better idea about which teams were really the best. Alas, players would miss too much class time, their bodies would be battered beyond recognition, and I would never leave the couch. As it is, we have to make do with the handful of games teams do play. In those games, we can learn a lot from a team’s YPP. Since 2005, I have collected YPP data for every conference. I use conference games only because teams play such divergent non-conference schedules and the teams within a conference tend to be of similar quality. By running a regression analysis between a team’s Net YPP (the difference between their Yards Per Play and Yards Per Play Allowed) and their conference winning percentage, we can see if Net YPP is a decent predictor of a team’s record. Spoiler alert. It is. For the statistically inclined, the correlation coefficient between a team’s Net YPP in conference play and their conference record is around .66. Since Net YPP is a solid predictor of a team’s conference record, we can use it to identify which teams had a significant disparity between their conference record as predicted by Net YPP and their actual conference record. I used a difference of .200 between predicted and actual winning percentage as the threshold for ‘significant’. Why .200? It is a little arbitrary, but .200 corresponds to a difference of 1.6 games over an eight game conference schedule and 1.8 games over a nine game one. Over or under-performing by more than a game and a half in a small sample seems significant to me. In the 2024 season, which teams in the Mountain West met this threshold? Here are Mountain West teams sorted by performance over what would be expected from their Net YPP numbers.

Boise State and Colorado State significantly exceeded their expected record based on Net YPP while the trio of San Jose State, New Mexico, and Nevada significantly underachieved. Boise State and Colorado State went a combined 6-1 in one-score conference games and also finished with good in-conference turnover margins. The Broncos were third in the Mountain West in that statistic (+6) and the Rams were second (+7). Close games explain Nevada's significant underachievement. The Wolfpack were winless in one-score conference games (0-4). More on them in a second. New Mexico had the worst in-conference turnover margin of any Mountain West team (-10). The Lobos forced just four turnovers in their seven league games. In their three league wins, the Lobos were had a turnover margin of -1, but in their four league losses, they were -9, including a combined -7 in losses to Colorado State and Fresno State. Close games (1-1) and turnovers (-4) don't do a great job of explaining San Jose State's underachievement. For the Spartans, it was a combination of a lot of things. They did have a negative in-conference turnover margin, but it wasn't horrendous. They also eschewed fourth down attempts (a league low seven attempts) and didn't do a great job of converting those attempts (three successful conversions). More aggression probably would have suited the Spartans. They also struggled scoring touchdowns in the red zone, converting just 56% of their red zone trips into touchdowns against Mountain West foes. Finally, they also struggled making kicks, hitting just four of seven field goal attempts in conference play. It wasn't just one thing, but a healthy combination that prevented San Jose State from finishing higher in the conference.
The Best Winless Team Ever
The above superlative requires a lot of qualifiers (mid-major team, winless in conference play, as adjudicated by Net YPP, since 2005), but it described the Nevada Wolfpack in 2024.
Nevada
fired Ken Wilson after back to back 2-10 finishes following the 2023 season. His replacement,
Jeff Choate, came from Texas, where he was the co-defensive coordinator, but he also had success as an FCS coach at Montana State. The Wolfpack seemed like they might be contenders in the Mountain West as they opened the season by
taking SMU to the brink at home and
beating the two-time defending Sun Belt champ Troy on the road. SMU ended up
making a quarterback change and Troy ended up
not being very good, so that start was a bit of a mirage. Though the Wolfpack were competitive in Choate's first season, they only won two other games after beating Troy and none of them came in Mountain West play. The Wolfpack were outgained by .33 yards per play by Mountain West opponents, a figure that ranked eighth in the twelve team league. Not great, but also not indicative of a team that would go winless in league play. In fact, Nevada posted the best Net YPP numbers of any mid-major (non-BCS/Group of Five) team that finished winless in conference play since I have been tracking the statistic (2005).

Around these parts, we are not only concerned with how teams performed in the past, but what that data might tell us regarding their future performance (for betting purposes, duh). How did the other nine teams on this list fare the following season? Read on to find out.
In the aggregate, the teams got better. Collectively, the nine teams improved from zero total conference wins to 22, meaning they won roughly two and half conference games on average. Seven of the nine teams improved and six of the nine improved by at least two games. However, it should be noted that improvement is not guaranteed. Two teams, Georgia State and SMU, went winless in their respective leagues the following season, though both do have some extenuating circumstances.
After finishing winless in Conference USA in 2007, SMU fired coach
Phil Bennett and replaced him with
Run N' Shoot aficionado
June Jones. 2008 may seem like yesterday, but college football has changed drastically since then. Jones was not able to revamp his entire roster in one offseason and the Mustangs struggled running his new offense, although they again posted respectable Net YPP numbers and just missed making this list. After struggling in 2008, the Mustangs won eight games (six in league play) in Jones' second season.
Georgia State's extenuating circumstances are they were new to FBS in 2013 and football in general. The Panthers played their
first game in school history in 2010 and were FBS team by their fourth season. Clearly, they were not ready for prime time, losing their first fifteen conference games in 2013 and 2014 before
beating New Mexico State for their first Sun Belt in in 2015.
Not only was Nevada arguably the best team to go winless in conference play, they also underachieved relative to their Net YPP numbers more than any other mid-major team since 2005 save one.
Only Utah State in 2016 underachieved more than Nevada in 2024. How did the other three teams on this list perform the following season? You already know SMU changed coaches and again failed to win a league game, but the other two teams improved dramatically.
In Shawn Elliott's first season at Georgia State, the Panthers finished with a winning Sun Belt record and
won their first ever bowl game. That same year, Utah State rebounded from a disappointing 2016 campaign and quadrupled their conference win total en route to a sixth bowl appearance in seven seasons.
Using history as a guide, I think there is a great chance Nevada not only improves in 2025, but also qualifies for a bowl game for the first time since 2021. I expect the Wolfpack to have a modest preseason win total, so the 'over' may be one of my big plays when I make my annual pilgrimage to Las Vegas.