We have come to the end of the line. This is the final FBS conference we will be reviewing. What happened in the Sun Belt in 2023?
Here are the 2023 Sun Belt standings.
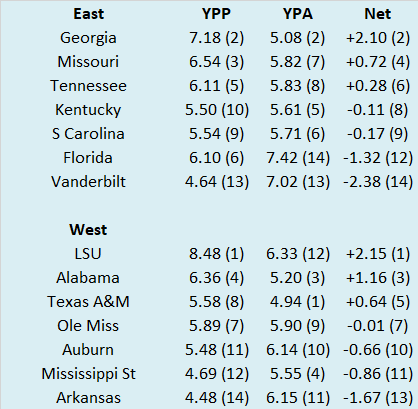
So we know what each team achieved, but how did they perform? To answer that, here are the Yards Per Play (YPP), Yards Per Play Allowed (YPA) and Net Yards Per Play (Net) numbers for each Sun Belt team. This includes conference play only, with the championship game not included. The teams are sorted by division, by Net YPP with conference rank in parentheses.

College football teams play either eight or nine conference games. Consequently, their record in such a small sample may not be indicative of their quality of play. A few fortuitous bounces here or there can be the difference between another ho-hum campaign or a special season. Randomness and other factors outside of our perception play a role in determining the standings. It would be fantastic if college football teams played 100 or even 1000 games. Then we could have a better idea about which teams were really the best. Alas, players would miss too much class time, their bodies would be battered beyond recognition, and I would never leave the couch. As it is, we have to make do with the handful of games teams do play. In those games, we can learn a lot from a team’s YPP. Since 2005, I have collected YPP data for every conference. I use conference games only because teams play such divergent non-conference schedules and the teams within a conference tend to be of similar quality. By running a regression analysis between a team’s Net YPP (the difference between their Yards Per Play and Yards Per Play Allowed) and their conference winning percentage, we can see if Net YPP is a decent predictor of a team’s record. Spoiler alert. It is. For the statistically inclined, the correlation coefficient between a team’s Net YPP in conference play and their conference record is around .66. Since Net YPP is a solid predictor of a team’s conference record, we can use it to identify which teams had a significant disparity between their conference record as predicted by Net YPP and their actual conference record. I used a difference of .200 between predicted and actual winning percentage as the threshold for ‘significant’. Why .200? It is a little arbitrary, but .200 corresponds to a difference of 1.6 games over an eight game conference schedule and 1.8 games over a nine game one. Over or under-performing by more than a game and a half in a small sample seems significant to me. In the 2023 season, which teams in the Sun Belt met this threshold? Here are Sun Belt teams sorted by performance over what would be expected from their Net YPP numbers.

South Alabama and Louisiana-Monroe significantly underachieved relative to their YPP numbers. South Alabama had an odd season in 2023, both in and out of Sun Belt play. These numbers don't include their non-conference games, but I just want to remind you the Jaguars beat Big 12 Championship Game participant Oklahoma State
by 26 points in Stillwater and
lost at home to a Central Michigan team that did not qualify for a bowl game. In league play, they beat three teams by four touchdowns and outgained Sun Belt opponents by nearly 3 yards per play in their four victories (6.72-3.82). Their four losses were mostly competitive, as they were outgained by 0.54 yards per play in those contests (5.46-6.00). Louisiana-Monroe was not good in 2023, but their per play numbers were not indicative of a team that goes winless in conference play. The Warhawks were 0-2 in one-score Sun Belt games, losing a pair of one-point decisions to Appalachian State and Texas State.
Phantom Division Champs
James Madison has arguably been the best team in the Sun Belt the past two seasons. But alas,
byzantine NCAA rules have prevented them from playing in the Sun Belt Championship Game. The Dukes won the Sun Belt East in 2022 (via tiebreaker) and 2023, but were forced to watch the conference title game from the comfort of their dorm rooms. This got me to wondering how often have there been 'phantom' division champions in FBS? Since divisional play only stretches back to 1992, I knew the research wouldn't take that long, so I was down. Here now, are the chronological listings of all phantom division champs in FBS history.

It should be no surprise that the SEC was the first conference to feature a phantom division champion. They were after all, trailblazers in both divisional play and cheating. And
cheating is why Auburn, despite an unbeaten campaign in Terry Bowden's first season, could not play in the SEC Championship Game. Instead, Alabama (the defending national champion) qualified for the title game with a weird 5-2-1 league record. Yes kids,
ties were unfortunately a thing in college football up until 1996. The Tide saddled up for a rematch of the
inaugural SEC Championship Game with Florida, but could not upset the Gators giving Steve Spurrier his first SEC Championship Game victory. The Gators and Tide would meet again in 1994 with the Gators again prevailing in the first SEC Championship Game contested in the league's ancestral home, Atlanta.

Nearly a decade would pass before the nation saw another phantom division champ. After being the beneficiary of Auburn's improprieties,
Alabama's sins allowed Arkansas to claim the SEC West crown in 2002. The Hogs finished in a three-way tied for second with Auburn and LSU, but beat both sets of Tigers on the field to earn the tiebreaker. They were mostly non-competitive in the title game, losing 30-3 to Mark Richt's first great Georgia team.

Probation and cheating are not responsible for this snafu. Instead, blame scheduling. The MAC featured an odd number of teams in 2007 (13), and somehow in this enlightened age, the conference thought it was a great idea to have each team play a different number of conference games. Six teams (all in the East division) played eight league games and seven played seven games. All six teams in the West played seven games and the one team that played seven in the East ended up being winning the division despite technically finishing a half game behind the division leader. Before the season began, the MAC announced that
division record would determine the winner of the East, but when you look back on the season more than a decade later, the standings do not make sense. Thankfully, the MAC realized their error and despite having an odd number of teams until 2015, had each team play eight league games so this was never repeated. And before Miami fans get angry, I know the Redhawks
beat Bowling Green on the field (handily) and would have won the division if both teams finished tied, but the fact remains that Miami did not have an opportunity to pick up an additional league loss since they only played seven conference games.

Southern Cal was a fringe top 25 team heading into 2011, barely cracking the preseason AP Poll in Lane Kiffin's second season. The Trojans were
banned from the postseason thanks to some shenanigans under Pete Carroll. They won their first three games, but were blown out by Arizona State and became an afterthought. Then a funny thing happened. They rolled through the rest of the regular season, winning seven of their final eight games with the only loss coming in overtime to Stanford. They even beat the eventual Pac-12 Championship Game participants in back-to-back weeks. They upset Oregon in Eugene in their penultimate game and then blasted their cross-town rivals 50-0. Those cross-town rivals were the only other team in the Pac-12 South that finished with a winning conference record so they faced off against Oregon in the
inaugural Pac-12 Championship Game. The game was not competitive, but the Bruins actually covered as a massive underdog. Southern Cal ended the season ranked sixth in the AP Poll and began the 2012 season (with no postseason restrictions) as the preseason number one team. They did not live up to the hype, losing four of their final five regular season games and closing the calendar year with an
indifferent performance against Georgia Tech in the Sun Bowl.

There were two phantom division champs in 2012. At least I think so. In the ACC, Georgia Tech, Miami, and North Carolina all finished with identical 5-3 records in the ACC Coastal. Miami self-imposed a one-year bowl ban due to the
Nevin Shapiro scandal and North Carolina was serving a postseason ban from the NCAA due to their
academic scandal. If Miami and North Carolina were both eligible, I think one of them would have gone to the ACC Championship Game, but I can't be sure. Not only did all three teams finish 5-3 in league play, they each went 1-1 against each other, and 3-2 versus the Coastal Division. Georgia Tech had the worst overall record (6-6), so I think the tie would have been broken by the BCS rating, but I'm not positive. Regardless, both the Hurricanes and Tar Heels were ineligible so Georgia Tech advanced to the title game and put up a decent fight against a Florida State team that would win the national title the following season.

In the Big 10, Wisconsin finished four games behind the true Leaders Division champion (Ohio State) and two games behind the runner-up (Penn State). Alas, 2012, was a popular year to be in trouble. Ohio State,
thanks to some tattoos was ineligible for the postseason, and Penn State, thanks to more nefarious reasons was also
ineligible. Wisconsin took advantage of their opportunity, hanging 70 on Nebraska in the Big 10 Championship Game to deny the Cornhuskers their first conference title since 1999.

Befitting a league that no longer exists, the Pac-12 was poorly managed in 2020. Initially, the conference
punted on the 2020 football season, but
reversed course and played an abbreviated campaign. In the abbreviated campaign, the Washington Huskies, led by first year head coach Jimmy Lake (
who wants to know?), won the North Division with a 3-1 record. However, before the Pac-12 Championship Game, they had a
Covid outbreak, so Oregon advanced to the title game on a technicality. The Ducks also finished behind Stanford in the Pac-12 standings as the league contested conference games on the same weekend as the title game. Oregon and Stanford were tied with identical 3-2 league records heading into conference championship weekend, with the Ducks owning the head-to-head tiebreaker over the Cardinal. Oregon upset unbeaten Southern Cal in the Pac-12 Championship Game and advanced to the Fiesta Bowl.

In their first year of play at the FBS level, James Madison finished tied with Coastal Carolina atop the Sun Belt East. However, the
Dukes dominated the Chanticleers in their regular season finale and would have won the tiebreaker had they been eligible for the Sun Belt Championship Game. In the title game, Coastal fell behind Troy 31-0, but managed a few late scores to make the final margin respectable.

Once again, the Dukes began the season knowing they would not be eligible for the Sun Belt Championship Game. Whether this served as motivation is fodder for message boards. However, the Dukes did win their first ten games and rise into the top 20 of the AP Poll before dropping an overtime game to Appalachian State. The Dukes finished a game clear of the Mountaineers in the Sun Belt standings, but once again were denied entry to the title game (and they
bitched about it a little). Like Coastal the previous season, Appalachian State did not fare well against Troy in the Sun Belt Championship Game.
Finally, before we leave, how did the phantom division champs perform in the aggregate in their fraudulent title game appearances?
All nine teams were underdogs in their respective title games. More than half were modest underdogs of less than a touchdown and only two were prohibitive underdogs. Only two were able to pull the upset and claim the conference title (both were field goal underdogs), but their ATS numbers were decent. The sample size is too small to glean any betting advice and since divisions have mostly gone the way of the buffalo, it may be quite sometime before we see another phantom division champ.