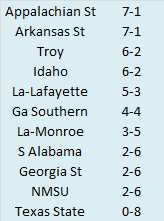
Nine conferences down, and now we move to our last FBS conference! Where did the time go? This week, we examine the Sun Belt. Here are the Sun Belt standings.
So we know what each team achieved, but how did they perform? To answer that, here are the Yards Per Play (YPP), Yards Per Play Allowed (YPA) and Net Yards Per Play (Net) numbers for each Sun Belt team. This includes conference play only. The teams are sorted by Net YPP with conference rank in parentheses.

College football teams play either eight or nine conference games. Consequently, their record in such a small sample may not be indicative of their quality of play. A few fortuitous bounces here or there can be the difference between another ho-hum campaign or a special season. Randomness and other factors outside of our perception play a role in determining the standings. It would be fantastic if college football teams played 100 or even 1000 games. Then we could have a better idea about which teams were really the best. Alas, players would miss too much class time, their bodies would be battered beyond recognition, and I would never leave the couch. As it is, we have to make do with the handful of games teams do play. In those games, we can learn a lot from a team’s YPP. Since 2005, I have collected YPP data for every conference. I use conference games only because teams play such divergent non-conference schedules and the teams within a conference tend to be of similar quality. By running a regression analysis between a team’s Net YPP (the difference between their Yards Per Play and Yards Per Play Allowed) and their conference winning percentage, we can see if Net YPP is a decent predictor of a team’s record. Spoiler alert. It is. For the statistically inclined, the correlation coefficient between a team’s Net YPP in conference play and their conference record is around .66. Since Net YPP is a solid predictor of a team’s conference record, we can use it to identify which teams had a significant disparity between their conference record as predicted by Net YPP and their actual conference record. I used a difference of .200 between predicted and actual winning percentage as the threshold for ‘significant’. Why .200? It is a little arbitrary, but .200 corresponds to a difference of 1.6 games over an eight game conference schedule and 1.8 games over a nine game one. Over or under-performing by more than a game and a half in a small sample seems significant to me. In the 2016 season, which teams in the Sun Belt met this threshold? Here are Sun Belt teams sorted by performance over what would be expected from their Net YPP numbers.

Idaho, in their penultimate season before
moving down to FCS over-performed relative to their expected record, while FBS newcomer, Georgia State under-performed. Idaho finished with the best in-conference turnover margin in the Sun Belt at +11 and was a solid 2-0 in one-score conference games. That little bit of good fortune coupled with a powerful passing attack helped the Vandals win six conference games for the first time in
school history. Georgia State can also blame turnovers for their poor record. The Panthers posted an in-conference turnover margin of -9 (which was not quite good enough for last place) and were also shoddy in the kicking game, making just 7 of 13 field goals in Sun Belt play.
If you were looking at the disparity between Sun Belt teams’ records and their expected YPP records and thought: ‘Hmmm. Georgia State sure did miss their expected record by a wide margin. I wonder if it was the widest margin ever.’ Well, I am here to answer that question. Here are the top (or bottom) ten mid-major teams since 2005 ranked by the largest disparity between their actual record and their expected record based on YPP.
Some notes on the table:
- In an interesting statistical coincidence, 2016 produced the two teams that missed their expected record by the widest margin. Utah State and Georgia State, along with SMU in 2007, were the only teams to miss their expected record by at least .400 (a little more than three wins in an eight-game conference season).
- Georgia State actually appears on this list twice, which is perhaps one reason why Trent Miles is no longer coaching the team.
- Four of the ten teams on this list (Georgia State, SMU, New Mexico, and FIU) ended up losing their coach either via firing (sometimes at midseason) or resignation.
- Chris Petersen’s best Boise State team probably does not belong on this list, but the Broncos were so dominant (+3.68 YPP in a pretty good WAC) that the regression analysis believed they should have won more than all their games.


No comments:
Post a Comment