Three years ago in the summer of 2014, I
imparted some gambling advice. Teams that struggled, but ultimately prevailed against FCS teams were pretty good value bets against the spread (ATS) in their next game. Specifically, teams that beat FCS teams by eight points or fewer (my definition of a close game) covered in their next game more than 63% of the time since 2005. Has that trend continued in the last three seasons? The short answer is ‘no’.
In a much shorter time frame and over a much smaller sample, the advantage appears to have disappeared. What if we further parse the ATS records by role?
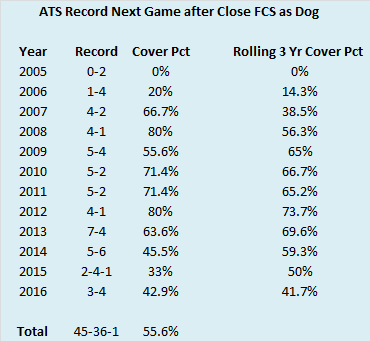
When these teams that struggle with FCS teams are underdogs the next week, they have performed poorly ATS. Favorites have remained a positive value, but in a sample size of just ten games, a shift of one game in the other direction would wipe out all the value in backing these teams.
Is this shift in value a sign that Las Vegas bookmakers have been anxiously following this blog and manually adjusting their numbers due to my advice (obviously) or is this just a random blip in an otherwise solid trend? Here are the ATS records for teams in their next game after winning a close game against an FCS team by year with a rolling three-year cover percentage thrown in.
In the past twelve seasons, teams in this situation have finished above the
gambler’s break-even percentage (52.4% assuming -110) eight times. However, three of the four instances of teams not finishing with cumulative ATS records above the break-even percentage have occurred in the past three seasons. The rolling three-year cover percentage has also declined for four straight seasons and is the lowest it has been in this time period.
The next two tables will break out the yearly cover percentage for teams in this situation by their role. We’ll start with underdogs.
Seven seasons of finishing above the break-even percentage are sandwiched around five seasons of falling below it (two in the beginning and three at the end). Overall, underdogs have still been slightly valuable over the past twelve seasons, but as in the aggregate, the rolling three-year cover percentage has declined for four consecutive seasons. What about favorites?
Favorites have finished above the break-even percentage in nine seasons, but there tend to be fewer teams in this role (about 3.7 per year versus 6.8 for underdogs). The rolling three-year cover
percentage has never fallen below the break-even percentage.
Finally, to provide a better visual representation, here is a graph of the overall, underdog, and favorite rolling three-year cover percentage. I also included the break-even percentage as a point of reference.

So what can we conclude from all this? A lot of data goes into creating the spread for football games. Casinos and bookmakers don’t typically lose money over the long run. This ‘trend’ of teams that struggle with FCS teams providing value in their next game could be a random blip. I did not look at an extremely large set of data. Even with twelve seasons worth, the number of observations is just 126. On the other hand, perhaps this three year period is the random blip in an otherwise solid trend. Or on a third hand, perhaps linemakers (without reading this blog) discovered this market inefficiency and have worked quietly over the past few years to correct it. Regardless, I am always fascinated by the point spread and this will be an area I follow closely not only in 2016, but for the rest of my football watching life.
Three years ago, I also included ATS information for teams that actually lose to FCS schools. Have those trends changed in the past three years? That’s what we in the business call a ‘tease’. Tune in next week to find out.


No comments:
Post a Comment