Another college football season has come and gone. The long, dark offseason is here. But don't fret too much. I'll be here to help you kill a little time over the next 20 weeks as each FBS conference gets the Yards Per Play (YPP) and Adjusted Pythagorean Record (APR) treatment. That will get us into May, when football is still a long way off, but at least the sun shines more. We'll take our sojourn alphabetically as we have for the past two years. That means we begin with the home of the
current national champion, the American Athletic Conference.
Here are the AAC standings.
So we know what each team achieved, but how did they perform? To answer that, here are the Yards Per Play (YPP), Yards Per Play Allowed (YPA) and Net Yards Per Play (Net) numbers for each AAC team. This includes conference play only, with the championship game not included. The teams are sorted by division by Net YPP with conference rank in parentheses.

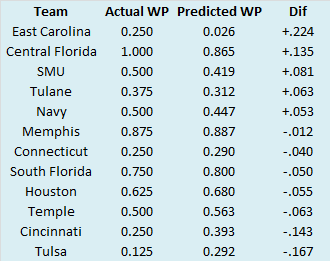
College football teams play either eight or nine conference games. Consequently, their record in such a small sample may not be indicative of their quality of play. A few fortuitous bounces here or there can be the difference between another ho-hum campaign or a special season. Randomness and other factors outside of our perception play a role in determining the standings. It would be fantastic if college football teams played 100 or even 1000 games. Then we could have a better idea about which teams were really the best. Alas, players would miss too much class time, their bodies would be battered beyond recognition, and I would never leave the couch. As it is, we have to make do with the handful of games teams do play. In those games, we can learn a lot from a team’s YPP. Since 2005, I have collected YPP data for every conference. I use conference games only because teams play such divergent non-conference schedules and the teams within a conference tend to be of similar quality. By running a regression analysis between a team’s Net YPP (the difference between their Yards Per Play and Yards Per Play Allowed) and their conference winning percentage, we can see if Net YPP is a decent predictor of a team’s record. Spoiler alert. It is. For the statistically inclined, the correlation coefficient between a team’s Net YPP in conference play and their conference record is around .66. Since Net YPP is a solid predictor of a team’s conference record, we can use it to identify which teams had a significant disparity between their conference record as predicted by Net YPP and their actual conference record. I used a difference of .200 between predicted and actual winning percentage as the threshold for ‘significant’. Why .200? It is a little arbitrary, but .200 corresponds to a difference of 1.6 games over an eight game conference schedule and 1.8 games over a nine game one. Over or under-performing by more than a game and a half in a small sample seems significant to me. In the 2017 season, which teams in the American Athletic Conference met this threshold? Here are AAC teams sorted by performance over what would be expected from their Net YPP numbers.

East Carolina was the only AAC team that saw their expected record differ significantly from their actual record. The Pirates were bad in 2017; by both their record and per-play numbers, but a team with the Pirates appalling overall statistics does not usually manage to win a quarter of their conference games. The Pirates played well in exactly one conference game, when they
hammered Cincinnati at home in their penultimate game. In the contest, they averaged nearly two more yards per play than the Bearcats. That result would prove to be an outlier as any hope for closing the season strong evaporated the next week when
Memphis hung 70 on them. All told, of East Carolina’s six conference losses, three came by at least 30 points, five came by at least 24 points, and only one came by single digits. The cumulative effect of those losses mitigated their one strong performance.
I know this is a retrospective of the American Athletic Conference for 2017, but this portion of the post will only be tangentially related to the AAC. I’ll be more AAC-centric next week, I promise.
Arkansas made what I thought was an interesting hire in
poaching Chad Morris from SMU and I wanted to address it. Is hiring Morris a good move for Arkansas, and perhaps even more importantly, is going to Arkansas a good move for Morris?
Chad Morris’ career record at SMU hardly stands out. In three full seasons, his teams managed just a 14-22 mark. His record in conference play was even worse at 8-16. Devoid of context, that does not sound like a record that will net you a Power Five job. Of course, context matters, and Morris was taking over a team that won just one game the season before he arrived. The Mustangs improved each season under his tutelage, going from two wins in his first season, to five in his second, to seven in his third. Obviously, within this framework, Chad Morris appears to be a solid hire as he raised the SMU program from the depths of college football to be a competitive team in the premiere mid-major conference. Of course, SMU was also in pretty bad shape when
Morris’ predecessor took over.
June Jones also took over an SMU team that won just a single game the year before he arrived. In addition, the Mustangs had posted just one winning season since returning from their
NCAA-mandated death penalty in 1989. You can make a cogent argument that Jones was stepping into a more hopeless situation. And if you look at the numbers, he did better than Morris in terms of resurrecting the program, particularly in conference play.
SMU may have finished just 7-7 in Jones’ third season, but they
won their division and played for the conference title. Even when the program was leaking oil at the end of his tenure, his final three seasons were comparable record-wise in the aggregate to the three Morris spent in Dallas.
Morris did coach in a tougher conference, but the Conference USA Jones coached in was better than the current iteration of Conference USA. Lest we forget, seven current members of the AAC came from Conference USA in 2013. My point is, Morris' rebuilding project is hardly unique in college football, especially when compared to his predecessor.
Let’s drill down a little more into Morris’ three years at SMU. Where did his teams excel? Where did they struggle? Here are the conference YPP and APR numbers for each of his three teams.

It’s pretty clear what side of the ball prevented SMU from winning more games in the AAC. His offenses improved each season and his final offense was the best in the AAC outside of Orlando and Memphis. The defense on the other hand…Put it this way, the next average defense Morris fields will be his first. His initial SMU team allowed over 45 points per game. His second team improved because it would be hard to be much worse, but still allowed over 36 points per game and his final team once again allowed over 36 points per game. If Morris were simply the offensive coordinator as he was at Clemson, this would not be any of his concern, but as head coach, it is his responsibility to recruit competent defensive players and hire coaches who can put them in position to succeed. He has not proven thus far that he is capable of doing that. And speaking of defense, care to guess what side of the football Arkansas needs the most help on?

It’s uncanny how bad Arkansas’ defense has been under Bret Bielema, especially the past two seasons. Allowing over seven yards per play in two consecutive seasons is quite an accomplishment. I guess we need to give Bert credit for somehow dragging the
2016 team to a bowl game. So Arkansas, with tremendous defensive deficiencies, hired an offensive-minded coach with a track record for bad defenses. What could go wrong?
Morris appears to understand what held his SMU teams back as Arkansas recently
hired esteemed SEC defensive coordinator John Chavis. Chavis has been with the conference since Tulane and
Sewanee were members and he has coordinated some fantastic defenses (most notably
LSU in 2011), but his career that encompasses the YPP and APR era is a mixed bag.
Chavis has never put a terrible defense on the field, but his last few years at LSU and his tenure at Texas A&M reeked of mediocrity. I know mediocrity in the SEC is above-average nationally, but it makes sense to compare Chavis to his conference peers especially since he is moving to a school that does not recruit as well as his previous three stops. And speaking of recruiting...
I am also confused why Morris would want to go to Arkansas (other than the obvious reason of exorbitant sums of money). By taking the Arkansas job, Morris has assured that he will be coaching a team that talent-wise is optimistically fifth best in the SEC
West. Let’s give Morris the benefit of the doubt and assume he can out-recruit Ole Miss and Mississippi State. He still has to contend with Alabama, Auburn, LSU, and Texas A&M every season. Do you really want to push that boulder year after year? I think hanging out in the AAC West until a better job opened up would be a superior course of action. Morris did have to deal with recruiting to a private school, but two other schools in the division (Tulane and Tulsa) have the same issues and another is a military academy (Navy). Houston and Memphis are the only large public schools in the division and both could potentially lose their head coaches in the next few years, giving Morris the advantage of stability at SMU.
I think Arkansas reached on a coach with a bad defensive track record coming off a rebuilding job that is not as impressive as it appears on the surface. I think Morris could have held out for a better job that did not include sharing a division with four perennial top-twenty teams. I’ve been wrong before (once or twice), but I don’t think this marriage is built to last.


No comments:
Post a Comment