After six straight weeks of major conference teams, let's show some live to the Group of Five. Next up is Conference USA. Here are the 2017 Conference USA standings.
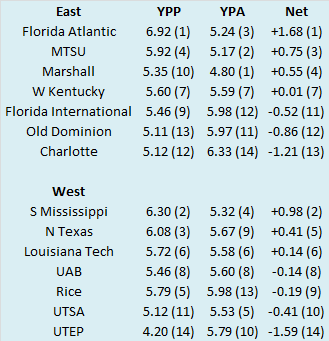
So we know what each team achieved, but how did they perform? To answer that, here are the Yards Per Play (YPP), Yards Per Play Allowed (YPA) and Net Yards Per Play (Net) numbers for each Conference USA team. This includes conference play only, championship game excluded. The teams are sorted by division by Net YPP with conference rank in parentheses.

College football teams play either eight or nine conference games. Consequently, their record in such a small sample may not be indicative of their quality of play. A few fortuitous bounces here or there can be the difference between another ho-hum campaign or a special season. Randomness and other factors outside of our perception play a role in determining the standings. It would be fantastic if college football teams played 100 or even 1000 games. Then we could have a better idea about which teams were really the best. Alas, players would miss too much class time, their bodies would be battered beyond recognition, and I would never leave the couch. As it is, we have to make do with the handful of games teams do play. In those games, we can learn a lot from a team’s YPP. Since 2005, I have collected YPP data for every conference. I use conference games only because teams play such divergent non-conference schedules and the teams within a conference tend to be of similar quality. By running a regression analysis between a team’s Net YPP (the difference between their Yards Per Play and Yards Per Play Allowed) and their conference winning percentage, we can see if Net YPP is a decent predictor of a team’s record. Spoiler alert. It is. For the statistically inclined, the correlation coefficient between a team’s Net YPP in conference play and their conference record is around .66. Since Net YPP is a solid predictor of a team’s conference record, we can use it to identify which teams had a significant disparity between their conference record as predicted by Net YPP and their actual conference record. I used a difference of .200 between predicted and actual winning percentage as the threshold for ‘significant’. Why .200? It is a little arbitrary, but .200 corresponds to a difference of 1.6 games over an eight game conference schedule and 1.8 games over a nine game one. Over or under-performing by more than a game and a half in a small sample seems significant to me. In the 2017 season, which teams in Conference USA met this threshold? Here are Conference USA teams sorted by performance over what would be expected from their Net YPP numbers.

While our last conference (Big 12) saw its standings pretty much conform to YPP, Conference USA presents us with a few outliers. North Texas, UAB, and Florida International exceeded their expected record and Rice under-performed relative to their peripherals. North Texas, UAB, and Florida International all posted solid records in close games, combining to finish 10-3 in one-score conference games. However, North Texas was the only team with an unsustainable record, as the Mean Green finished 4-0 in such contests. The Blazers (3-2) and Panthers (3-1) were well within the standard deviation for close games in such a small sample as an eight game conference season. UAB also boasted the second best in-conference turnover margin among Conference USA teams (+8), while North Texas (-6) and Florida International (+1) were not propped up by fantastic turnover margins. Finally, North Texas and Florida International can attribute some of their success to the kicking game. The Mean Green and Panthers combined to make 25 of 27 field goals in conference games. No coach or fan wants to settle for a field goal attempt in lieu of a touchdown, but making them is always preferable to missing them. As for Rice, they were 0-2 in one-score conference games, had the worst in-conference turnover margin of any team in Conference USA (-11), and were one of the worst teams in the nation at
finishing drives. Rice attempted just five field goals all season (four in conference play) and converted just three (two in conference play). They also converted less than 40% of their fourth down attempts. These turnovers, missed kicks, and failed conversions all combined to make Rice look much worse than their bad, but hardly debilitating peripherals.
If you follow Conference USA closely, you probably noticed the
2017 standings looked markedly different from the ones of the
prior year. The two participants in the 2017 conference championship game both finished with losing conference records the previous year. The 2016 co-champs from the east (Old Dominion and Western Kentucky) finished four and three games worse respectively in conference play. Marshall shared the east cellar with Florida Atlantic in 2016, but rebounded to win half their conference games in 2017. UAB didn’t even play football in 2016, yet they nearly won the west in 2017. In short 2017 was mass hysteria, dogs and cats living together, real wrath of god type
stuff. What can we expect from those teams moving forward? Were their gains and losses a signal of where they will be in 2018 or were they just a lot of noise? Specifically, I want to examine the three teams that saw significant differences in their 2016 and 2017 conference records. I’ll define significant as a difference of at least four conference games. Since the conference season is only eight games long, finishing four or more games better or worse makes a profound difference in the standings. Three teams in Conference USA finished with a conference record at least four games different from 2016.
This week I want to focus on the two teams that improved significantly in 2017, and also matched up in the
Conference USA Championship Game. We’ll look at Old Dominion next week. To get an idea of what to expect from the Owls and Mean Green going forward, I looked to the past. I examined every mid-major (non BCS or Group of Five) team that won at least four additional conference games than they had the previous season since 2005. This query yielded 33 teams, not including the four that accomplished the feat in 2017 (in addition to Florida Atlantic and North Texas, Fresno State and the
national champions from UCF also improved their conference record by at least four games). How did those 33 teams perform the following season? The results are summarized below.
More than three quarters of those teams saw their conference record decline the following season and nearly 58% of the teams saw their conference record decline by at least two games. Only about nine percent of the teams further solidified their gains and improved their conference record. Overall, the average team declined by nearly two conference wins.
Of course, I would be remiss if I did not mention one extreme outlier.
UCF finished conference play 0-8 in 2015. They hired Scott Frost and improved significantly in 2016, finishing 4-4. Frost and his charges scoffed at regression’s magnetic pull and further improved to 8-0 in 2017. As the previous table shows, only three teams saw continued improvement after their one season of significant improvement. Those other two teams both improved by one game apiece (UCF from 2012 to 2013 and Air Force from 2013 to 2014 if you were curious). In the interest of full disclosure, this is what the averages would look like if Scott Frost’s UCF team did not exist.
Suffice it to say, Florida Atlantic and North Texas face an uphill battle to return to the championship game in 2018. Obviously, it would be impossible for Florida Atlantic to improve upon their conference record in 2018, but don’t just assume the
Lane Train will keep barreling along. There may be trouble ahead or even
trouble behind. Similarly, North Texas will also face challenges in defending their division title. And when you consider they were probably a little lucky to win the division in the first place, at least according to YPP, they would be my bet to not meet expectations in 2018.


No comments:
Post a Comment