Last week, we looked at how Sun Belt teams fared in terms of yards per play. This week, we turn our attention to how the season played out in terms of the Adjusted Pythagorean Record, or APR. For an in-depth look at APR, click here. If you didn’t feel like clicking, here is the Reader’s Digest version. APR looks at how well a team scores and prevents touchdowns. Non-offensive touchdowns, field goals, extra points, and safeties are excluded. The ratio of offensive touchdowns to touchdowns allowed is converted into a winning percentage. Pretty simple actually.
Once again, here are the 2017 Sun Belt standings.
And here are the APR standings with conference rank in offensive touchdowns, touchdowns allowed, and APR in parentheses. This includes conference games only.
Finally, Sun Belt teams are sorted by the difference between their actual number of wins and their expected number of wins according to APR.
Georgia State was the lone Sun Belt team that saw their actual record differ significantly from their APR. In eight conference games, the Panthers allowed five more touchdowns than they scored and were outscored by 28 points overall in conference play. However, the Panthers scored at the right times, finishing 4-0 in one-score conference games. Their five league wins all came by ten points or fewer while each league loss came by at least two touchdowns. That’s quite a tightrope to walk and I have my doubts as to whether they can keep their balance for much longer.
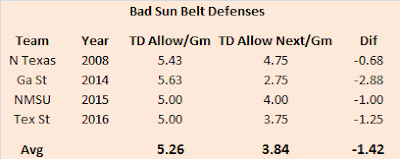
Louisiana-Monroe finished with a losing record for the fourth consecutive season, but the Warhawks played an entertaining brand of football in 2017. They scored the most touchdowns in Sun Belt play, averaging five per contest, but also allowed the most, permitting 5.63 per game. Offensively, they were one of the best Sun Belt teams since I have been tracking APR data (2005). Conversely, they were also one of the worst Sun Belt defenses in that same span. It stands to reason then that a small improvement on defense or a small decline on offense could have a profound impact on the Warhawks in 2018. But which is more likely? Do strong Sun Belt offenses remain that way or do they regress? Do bad Sun Belt defenses stay bad or do they show improvement the next season? To find out, I looked at all Sun Belt offenses that averaged at least five touchdowns per conference game since 2005 and how they performed the following season. I then did the same thing for Sun Belt defenses that allowed at least five touchdowns per conference game. Let’s get to the results, starting with the great offenses.
As expected, these great offenses declined in the aggregate. However, one team managed to improve and the average decline of about two thirds of a touchdown per game still left these teams in great shape offensively. For perspective, that average of 4.56 offensive touchdowns per game would have ranked fourth in the Sun Belt in 2017. What about those bad defenses?
Once again, as expected, those extreme performances were not repeated. Every bad defense improved the following season, and three improved by at least one touchdown per game. I know this is an extremely small sample size, but I would be cautiously optimistic about 2018 were I a Warhawk fan. Matt Viator will be entering his third season in charge, a year when teams often improve. In addition, the offense is likely to remain one of the best in the Sun Belt while the defense is likely to improve upon their horrific
performance in 2017. A conference title might be too ambitious, but a return to the postseason is certainly on the table.
Well, that concludes our conference by conference dive into the 2017 season. Unfortunately, we still have 13 more weeks until the first Thursday night action of 2018. Between now and then, expect to see a few posts on polls, a Vegas gambling recap, and an Adjusted Pythagorean look at the NFL. I don't have a specific schedule laid out, but check back once a week or so if you are dying for some Statistically Speaking content. As always, thanks for reading.


No comments:
Post a Comment