We breezed through the AAC, so next up in our conference breakdowns is the ACC.
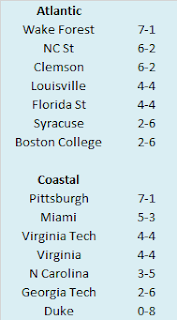
Here are the 2021 ACC standings.
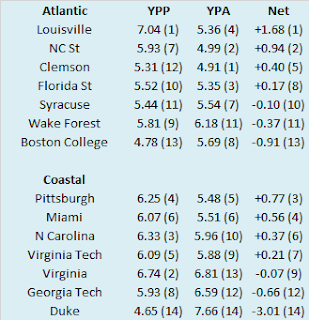
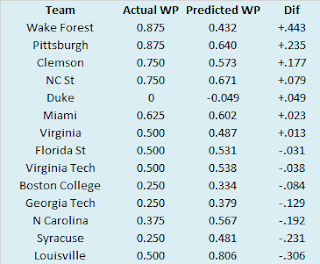
So we know what each team achieved, but how did they perform? To answer that, here are the Yards Per Play (YPP), Yards Per Play Allowed (YPA) and Net Yards Per Play (Net) numbers for each ACC team. This includes conference play only, with the championship game not included. The teams are sorted by division by Net YPP with conference rank in parentheses. Also note, the Wake Forest/North Carolina game is not included in these numbers either as that was not a conference game. College football teams play either eight or nine conference games. Consequently, their record in such a small sample may not be indicative of their quality of play. A few fortuitous bounces here or there can be the difference between another ho-hum campaign or a special season. Randomness and other factors outside of our perception play a role in determining the standings. It would be fantastic if college football teams played 100 or even 1000 games. Then we could have a better idea about which teams were really the best. Alas, players would miss too much class time, their bodies would be battered beyond recognition, and I would never leave the couch. As it is, we have to make do with the handful of games teams do play. In those games, we can learn a lot from a team’s YPP. Since 2005, I have collected YPP data for every conference. I use conference games only because teams play such divergent non-conference schedules and the teams within a conference tend to be of similar quality. By running a regression analysis between a team’s Net YPP (the difference between their Yards Per Play and Yards Per Play Allowed) and their conference winning percentage, we can see if Net YPP is a decent predictor of a team’s record. Spoiler alert. It is. For the statistically inclined, the correlation coefficient between a team’s Net YPP in conference play and their conference record is around .66. Since Net YPP is a solid predictor of a team’s conference record, we can use it to identify which teams had a significant disparity between their conference record as predicted by Net YPP and their actual conference record. I used a difference of .200 between predicted and actual winning percentage as the threshold for ‘significant’. Why .200? It is a little arbitrary, but .200 corresponds to a difference of 1.6 games over an eight game conference schedule and 1.8 games over a nine game one. Over or under-performing by more than a game and a half in a small sample seems significant to me. In the 2021 season, which teams in the ACC met this threshold? Here are ACC teams sorted by performance over what would be expected from their Net YPP numbers. Wake Forest and Pittsburgh, the two conference title game participants, both overachieved relative to their expected record based on YPP while Syracuse and Louisville underachieved. Wake had the best in-conference turnover margin (+9) in the ACC, went 3-0 in one-score conference games, and were absurdly efficient on fourth downs in ACC play, going 10 for 11. Pittsburgh had a decent in-conference turnover margin (+2), but nothing spectacular. The Panthers were also mediocre in one-score games (1-1 in ACC play), but did benefit from great fourth down defense. Their ACC opponents combined to convert just 3 of 16 fourth down attempts, giving them a hidden thirteen additional forced turnovers. Meanwhile, Syracuse was 1-3 in one-score conference games. This close game deficiency was partly due to lack of an effective kicking game (made just 4 of 7 field goals in ACC play) and ridiculously bad luck when opponents were forced to kick (ACC teams made all 14 of their field goal attempts against the Orange). Louisville was also 1-3 in one-score ACC games causing them to finish with a .500 league record despite the best Net YPP in the conference.
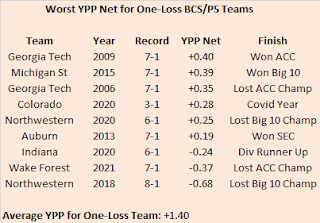
Worst One-Loss Teams
You may have noticed that Wake Forest was actually underwater in terms of Net YPP. On a per play basis, the Demon Deacons were outgained by slightly more than one third of a yard (one foot). Despite this inefficiency, the Demon Deacons won their division for the second time in school history (they have as many ACC Championship Game appearances as the other three North Carolina schools combined) and finished with but a single conference loss. I have YPP data going back to 2005, so I wanted to see where my alma mater ranked in that metric among BCS/P5 teams that finished with a similar conference record. Believe it or not, they do not have the worst Net YPP of that group. Wake had the second worst Net YPP of any BCS/P5 team that finished with one conference loss. A Northwestern team from a few years ago actually beat them by a significant margin. That Northwestern team lost to Akron and Duke in non-conference play but won eight of nine in Big 10 action. They also acquitted themselves reasonably well in the Big 10 Championship Game, trailing by seven with under ten minutes to go before Ohio State pulled away. In fact, despite their underwhelming YPP numbers, the teams on this list performed well in their respective conference title games. Seven of the nine teams won their division and those teams went a respectable 3-4 in conference title games. Two of the teams even contended for national championships, with Auburn losing in the final BCS Championship Game in 2013 and Michigan State qualifying for the CFP in 2015 (though their showing in the CFP was not great). These teams continued to confound their underlying numbers in the conference title games, but the next season was a different story. None of the previous eight finished with a winning conference record in the follow up season. As a Wake Forest fan, I must remember to enjoy this season for what it was and not expect a repeat performance in 2022.
No comments:
Post a Comment