We are careening toward the home stretch of our conference reviews. Next up is the Pac-12.
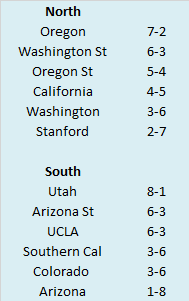
Here are the 2021 Pac-12 standings.
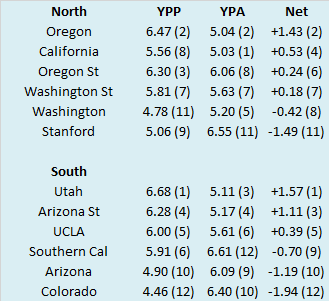
So we know what each team achieved, but how did they perform? To answer that, here are the Yards Per Play (YPP), Yards Per Play Allowed (YPA) and Net Yards Per Play (Net) numbers for each Pac-12 team. This includes conference play only, with the championship game not included. The teams are sorted by division by Net YPP with conference rank in parentheses.
Three Downs
Southern Cal, Stanford and Washington are historically speaking, three of the top programs in the Pac-12. In fact, one could argue they are the best. You can make a case for Oregon, especially if you were born in the 21st century. But for the purposes of this post, lets assume those three are the standard bearers for the Pac-12. Those three teams finished with a combined conference record of 8-19 in 2021. This marked the first time their cumulative conference record was below .500 since 2008 and was only the fifth such occurrence this century.

Oregon State and Washington State finished a combined 11-7 in Pac-12 play last season. The Beavers and Cougars went a combined 5-1 against Southern Cal, Stanford, and Washington. Oregon State beat all three. Their victory against the Trojans was their first since 2010 (lost previous four). They beat Washington for the first time since 2011 (lost previous nine) and Stanford for the first time since 2009 (lost previous eleven). Washington State beat Washington and Stanford, but lost to Southern Cal. Their victory against the Huskies was their first since 2012 (lost previous seven) and their win against Stanford was actually their fifth in a row against the Cardinal. The problem for middle weights like Oregon State and Washington State is that when programs the caliber of Southern Cal, Stanford, and Washington have bad or disappointing seasons, they often upgrade at head coach. That is precisely what Southern Cal and Washington presumably did in the offseason. The Trojans hired a proven head coach from Oklahoma while Washington hired an up and comer from the Group of Five. Stanford stood pat behind their long tenured head coach, but Southern Cal and Washington are likely to see improvement (perhaps significantly) in 2022. I don't know what to make of Stanford and their decline in recent years, but moderate improvement in Palo Alto would not shock me either. What does this mean for Oregon State and Washington State in 2022? They play all three teams again in 2022 and the odds of them finishing 5-1 (or better) against the trio are slim. Their 11-7 combined record from last season means they went just 6-6 against the rest of their Pac-12 slate. A bowl game for either the Beavers or Cougars is not a sure thing and my initial take would be to look at the 'under' on their season win totals when those numbers are released.
No comments:
Post a Comment