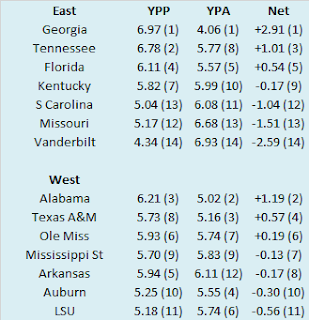
Here are the 2021 SEC standings.
So we know what each team achieved, but how did they perform? To answer that, here are the Yards Per Play (YPP), Yards Per Play Allowed (YPA) and Net Yards Per Play (Net) numbers for each SEC team. This includes conference play only, with the championship game not included. The teams are sorted by division by Net YPP with conference rank in parentheses.
College football teams play either eight or nine conference games. Consequently, their record in such a small sample may not be indicative of their quality of play. A few fortuitous bounces here or there can be the difference between another ho-hum campaign or a special season. Randomness and other factors outside of our perception play a role in determining the standings. It would be fantastic if college football teams played 100 or even 1000 games. Then we could have a better idea about which teams were really the best. Alas, players would miss too much class time, their bodies would be battered beyond recognition, and I would never leave the couch. As it is, we have to make do with the handful of games teams do play. In those games, we can learn a lot from a team’s YPP. Since 2005, I have collected YPP data for every conference. I use conference games only because teams play such divergent non-conference schedules and the teams within a conference tend to be of similar quality. By running a regression analysis between a team’s Net YPP (the difference between their Yards Per Play and Yards Per Play Allowed) and their conference winning percentage, we can see if Net YPP is a decent predictor of a team’s record. Spoiler alert. It is. For the statistically inclined, the correlation coefficient between a team’s Net YPP in conference play and their conference record is around .66. Since Net YPP is a solid predictor of a team’s conference record, we can use it to identify which teams had a significant disparity between their conference record as predicted by Net YPP and their actual conference record. I used a difference of .200 between predicted and actual winning percentage as the threshold for ‘significant’. Why .200? It is a little arbitrary, but .200 corresponds to a difference of 1.6 games over an eight game conference schedule and 1.8 games over a nine game one. Over or under-performing by more than a game and a half in a small sample seems significant to me. In the 2021 season, which teams in the SEC met this threshold? Here are SEC teams sorted by performance over what would be expected from their Net YPP numbers.
Ole Miss and Florida were the SEC teams that saw their actual record differ significantly from their expected record. The Rebels overachieved by winning both of their one-score conference games and posting the best in-conference turnover margin (+5) of any SEC team. Meanwhile, Florida ended the Dan Mullen era by dropping their final four SEC games. Of their six conference defeats, four came by a touchdown or less. The Gators also had the worst in-conference turnover margin of any SEC team (-8) and were done in by non-offensive touchdowns. In eight conference games, the Gators allowed four non-offensive touchdowns without scoring any of their own. Two of those non-offensive touchdowns provided the exact margin of defeat in games against Kentucky (blocked field goal) and LSU (interception). The other two did not directly result in defeat, but turnovers that resulted in non-offensive touchdowns late in the first half in back to back weeks against Georgia (interception) and South Carolina (fumble) effectively ended any hopes of a Florida comeback.
Dominating Conference Opponents
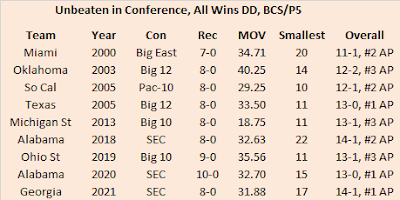
Alabama won the 2017 College Football Playoff in dramatic fashion. While the ending was an all-timer, that Alabama team was nondescript compared to other national champions of the modern era (since 1984). However, beginning with Clemson in 2018, the next three national champions (LSU in 2019 and Alabama in 2020) all had a legitimate claims to the be the best of all time. On the morning of December 4, 2021, it appeared Georgia would be able to make a similar claim once the season ended. The Bulldogs entered the SEC Championship Game having beaten ten Power Five opponents by an average of nearly 31 points per game. After a sluggish opener against Clemson in Charlotte, the Bulldogs had not been challenged by any team, leading all their conference opponents by at least a touchdown at halftime en route to the SEC East title. Even a loss to Alabama would not necessarily invalidate their argument as the best team ever. Other great teams like Florida in 2008 or Alabama in 2011 had dropped close games (at home no less) only to regroup and be regarded as some of the best ever once their body of work was examined. It was not the loss to Alabama that curtailed their run at 'best ever' status, it was the magnitude of the defeat. Alabama led by 14 points entering the fourth quarter and pushed their lead to 21 with about twelve minutes left. The 17 point final margin was not misleading. Alabama shredded a previously impenetrable Georgia defense for 526 yards and scored nearly as many points (41) as the Bulldogs allowed in their first seven conference games (49). But you know how this story ends. This was just a temporary setback for Georgia. They rebounded and exorcised their Alabama demons in the College Football Playoff, winning their first national title since 1980. Although, they will probably not go down as they best team ever, they should be remembered for their dominant performance in SEC play. In the BCS era (since 1998), they are one of just eighteen teams to finish unbeaten in conference play and win all their games by double-digits. What illustrious company have they joined? See for yourself, starting with the non-BCS/Group of Five teams.
No surprise to see a couple Boise State teams on this list. And lets not forget Marshall's dominance of the MAC when they moved up to FBS in the late 90's or the original BCS busters in Salt Lake City. Of course, that's just the appetizer. You probably came for the entree. Here are the BCS/Power Five teams that have finished unbeaten in conference play with each victory coming by at least ten points.
It may be a little surprising that only three of the nine BCS/Power Five teams that dominated their conference opponents went on to win the national championship (with two coming in the past two seasons). Other observations from the table: The 2000 Miami Hurricanes dominated their Big East brethren more so than the 2001 and 2002 teams that played for national titles. If the College Football Playoff existed in 2000, Bob Stoops may never have won a national title! 2005 was the only time that two BCS/Power Five teams dominated their conference opponents to such an extent in the same season. Finally, Michigan State's dominance in 2013 is often overlooked. The Spartans lacked the offensive firepower of the other teams on this list (note their margin of victory is by far the smallest), but their defense was rock solid in allowing just eleven points per game in Big 10 play. Their lone loss that season was at Notre Dame in a game where they allowed just 17 points.
One trend I noticed when conducting this research was the lack of success these dominant teams had in their respective conference title games. Twelve of these teams played in conference title games after their dominant regular seasons. While they did well straight up, they hemorrhaged cash for those betting on them.
Ten of the twelve were favorites in their respective conference title games. Those ten teams finished 7-3 straight up, but were 1-9 Against the Spread (ATS). Two of the twelve teams were underdogs in their conference title games. The aforementioned Michigan State team faced an unbeaten Ohio State led by Urban Meyer then in his second season in Columbus. The other instance happened in the pandemic-shortened 2020 season when San Jose State faced an unbeaten (in conference play) Boise State team in the Mountain West Championship Game. Both underdogs not only covered, but won the games outright. Why have these dominant favorites performed so poorly ATS in conference title games? Going undefeated is hard. Perhaps the pressure of the moment gets to these teams, especially in an event that is branded as a 'championship'. Or perhaps these massive favorites take their opponents lightly. Their other conference opponents did not put up much resistance throughout the year, so maybe they expect more of the same in the conference title game. Or maybe the oddsmakers have made these numbers too high. The favorites are 7-3 straight up, so they are winning these games, just not covering. Or maybe ten games is too small a sample to draw any significant conclusions from. What do you think? Why have these dominant teams struggled in conference title games?


No comments:
Post a Comment