Here are the 2022 Big 12 standings.
So we know what each team achieved, but how did they perform? To answer that, here are the Yards Per Play (YPP), Yards Per Play Allowed (YPA) and Net Yards Per Play (Net) numbers for each Big 12 team. This includes conference play only, with the championship game not included. The teams are sorted by Net YPP with conference rank in parentheses.
College football teams play either eight or nine conference games. Consequently, their record in such a small sample may not be indicative of their quality of play. A few fortuitous bounces here or there can be the difference between another ho-hum campaign or a special season. Randomness and other factors outside of our perception play a role in determining the standings. It would be fantastic if college football teams played 100 or even 1000 games. Then we could have a better idea about which teams were really the best. Alas, players would miss too much class time, their bodies would be battered beyond recognition, and I would never leave the couch. As it is, we have to make do with the handful of games teams do play. In those games, we can learn a lot from a team’s YPP. Since 2005, I have collected YPP data for every conference. I use conference games only because teams play such divergent non-conference schedules and the teams within a conference tend to be of similar quality. By running a regression analysis between a team’s Net YPP (the difference between their Yards Per Play and Yards Per Play Allowed) and their conference winning percentage, we can see if Net YPP is a decent predictor of a team’s record. Spoiler alert. It is. For the statistically inclined, the correlation coefficient between a team’s Net YPP in conference play and their conference record is around .66. Since Net YPP is a solid predictor of a team’s conference record, we can use it to identify which teams had a significant disparity between their conference record as predicted by Net YPP and their actual conference record. I used a difference of .200 between predicted and actual winning percentage as the threshold for ‘significant’. Why .200? It is a little arbitrary, but .200 corresponds to a difference of 1.6 games over an eight game conference schedule and 1.8 games over a nine game one. Over or under-performing by more than a game and a half in a small sample seems significant to me. In the 2022 season, which teams in the Big 12 met this threshold? Here are Big 12 teams sorted by performance over what would be expected from their Net YPP numbers.
TCU and Texas Tech significantly exceeded their expected record based on YPP while Kansas and Iowa State underachieved. TCU and Texas Tech combined to finish 7-0 in one-score Big 12 games, buoying their respective league records. TCU also had the best in-conference turnover margin in Big 12 play (+7) and while Texas Tech was insanely aggressive under first year head coach Joey McGuire (lead nation in fourth down attempts), they managed to convert an unsustainable percentage of their fourth downs (64%). Iowa State finished 0-6 in one-score Big 12 games and also had the worst in-conference turnover margin (-10). Kansas was not unfortunate in close Big 12 games (1-1 record), but their defense could not get off the field in high-leverage situations, allowing Big 12 opponents to covert nearly 73% of their fourth down attempts.
Closing the Deal
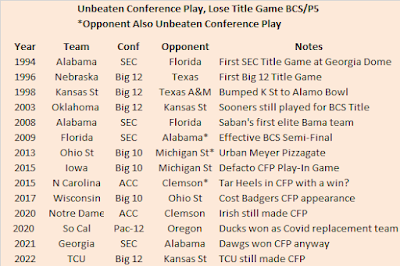
TCU became the first Big 12 team other than Oklahoma to make the College Football Playoff in 2022. They became the first Big 12 team to play for a national championship since Texas in 2009. And they were also the first ever Big 12 team to win a College Football Playoff Game. Tremendous accolades all. However, I derive pleasure from pointing out failure. And did you know that TCU did not even win the Big 12 in 2022? In fact, they joined a longer than expected list of BCS/Power Five teams to finish unbeaten in conference play and lose their conference title game.
2022 marked the third consecutive year this phenomenon occurred. Despite the setbacks, the three legitimate contenders were still selected by the CFP Committee (Southern Cal was 13th in the penultimate CFP rankings in 2020 and were unlikely to qualify had they beaten Oregon in the Pac-12 Championship Game).
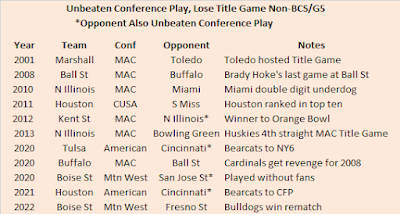
The list of non-BCS/Group of Five teams to lose their conference title game after rolling through league play with an unblemished record is not much shorter.
This trend has also happened at the Group of Five level each of the past three seasons, including thrice in the Covid year of 2020.
We had a little fun at TCU's expense in this post, but I want to congratulate the Horned Frogs on a great season. For my money, the 2014 team was better and just as deserving of a CFP bid. Plus, I would have loved to have seen what the 2009 or 2010 teams could have done in a system that did not exclude non-BCS conference schools.


No comments:
Post a Comment