Thursday, February 27, 2025

2024 Adjusted Pythagorean Record: Big 10

Last week we looked at how Big 10 teams fared in terms of yards per play. This week, we turn our attention to how the season played out in terms of the Adjusted Pythagorean Record, or APR. For an in-depth look at APR, click here. If you didn’t feel like clicking, here is the Reader’s Digest version. APR looks at how well a team scores and prevents touchdowns. Non-offensive touchdowns, field goals, extra points, and safeties are excluded. The ratio of offensive touchdowns to touchdowns allowed is converted into a winning percentage. Pretty simple actually.

Once again, here are the 2024 Big 10 standings.
And here are the APR standings with conference rank in offensive touchdowns, touchdowns allowed, and APR in parentheses. This includes conference games only with the championship game excluded.
Finally, Big 10 teams are sorted by the difference between their actual number of wins and their expected number of wins according to APR.
I use a game and a half as a somewhat arbitrary standard to determine if any teams significantly overachieved or underachieved relative to their APR. By that standard, Michigan State overachieved while Southern Cal and Wisconsin underachieved. Michigan State was not particularly fortunate in close games (2-1 record in one-score Big 10 games), but the Spartans were blown out in nearly all of their conference defeats. Five of their six Big 10 losses came by at least 20 points. Meanwhile, Southern Cal was quite unlucky in their close game performance. The Trojans finished 2-5 in one-score Big 10 games, with all of their losses coming by a touchdown or less and three coming by a field goal or less. Wisconsin is a little tougher to get a read on as the Badgers were 0-1 in close games, but scored more touchdowns that they allowed despite winning just a third of their Big 10 games. Wisconsin really ran up the score against Purdue and Rutgers, beating the Boilermakers and Scarlet Knights by a combined 81 points and artificially inflating their APR. 

Indiana and Dramatic Improvements in Conference Record
Curt Cignetti certainly has some bluster. During a press conference shortly after his hiring, Cignetti famously said: It's pretty simple. I win. Google me. Cignetti made good on that drunken boast by winning eleven games and guiding the Hoosiers to the expanded College Football Playoff. In conference play, Indiana improved their conference record by an incredible seven games, going from 1-8 to 8-1. What are reasonable expectations after such an immense improvement? To answer that question, I looked at all BCS/Power conference teams that improved their conference record by more than .500 from one season to the next. Between 1998 and 2023, 25 teams (roughly one per season) accomplished this feat, making it much more common than I anticipated. Those teams are listed chronologically in the table below. 
Auburn, in Gus Malzahn's first season on The Plains took the biggest leap, improving by an incredible .875 in going from zero SEC wins to seven. That Auburn team and five others have an asterisk by their name as they were led by first year coaches, much like Indiana was in 2024. We'll get back to that in a moment. In the meantime, the cumulative improvement of those 25 teams is summarized below. 
So what are reasonable expectations for Indiana in 2025? Well, lets look to the past. How did those other 25 teams perform the next season after making big strides?
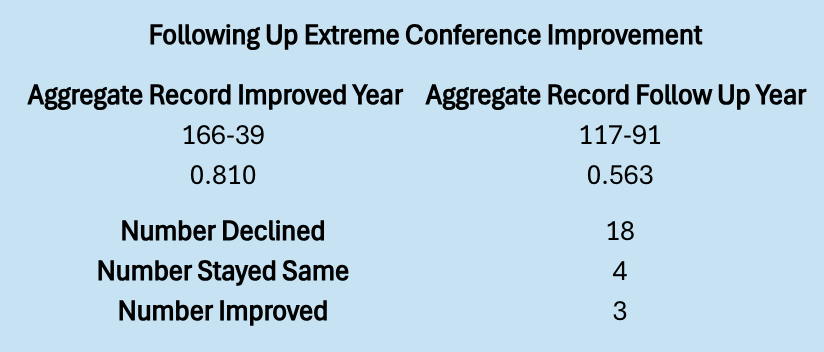
In the aggregate, they declined in conference winning percentage by nearly .250! That's roughly two wins over an eight game conference schedule or two and a quarter wins over a nine game schedule (as the Hoosiers play in the Big 10). 18 of the 25 teams (72%) saw their conference win percentage decline while only 3 of 25 (12%) further improved their conference win percentage. 

Indiana was not the only Power conference team that improved significantly from 2023 to 2024. A trio of Big 12 teams also improved their fortunes substantially. 
Arizona State won the Big 12 and, like Indiana, made the expanded College Football Playoff. BYU and Colorado didn't reach those heights, but they came oh so close, finishing tied with the Sun Devils and Iowa State Cyclones atop the Big 12 standings. Inquisitive readers (if any) may be wondering why I did not save this post for the Big 12 YPP and APR recaps. Simple. Those three teams were not led by a first year coach. Kenny Dillingham and Coach Prime were in their second seasons at Arizona State and Colorado respectively, while Kalani Sitake somehow just finished his ninth season at BYU. Do first year head coaches that drastically improve their teams' fortunes fare differently in their follow up campaigns? The answer may surprise you. 
Unfortunately, our sample size is quite small (six coaches), but the results are not far off from the aggregate of all coaches that significantly improved their teams' conference record. Those six coaches lost about .227 in conference winning percentage the next season (compared to .247 for all coaches regardless of tenure). Five of six saw their conference record decline the following season with only Urban Meyer at Ohio State maintaining his a perfect league mark in his second season. 

If we use history as our guide, Indiana fans should expect to win about five or six conference games in 2025. That probably won't be enough to get them into the College Football Playoff, but consecutive winning Big 10 records is something that has happened just three times at Indiana in the past 60 years!

Thursday, February 20, 2025

2024 Yards Per Play: Big 10

Two conferences down, seven to go. This week we head to the midwest where the current national champion resides. This is how things played out in the Big 10 in 2024. 

Here are the 2024 Big 10 standings.
So we know what each team achieved, but how did they perform? To answer that, here are the Yards Per Play (YPP), Yards Per Play Allowed (YPA) and Net Yards Per Play (Net) numbers for each Big 10 team. This includes conference play only, with the championship game not included. The teams are sorted by Net YPP with conference rank in parentheses.
College football teams play either eight or nine conference games. Consequently, their record in such a small sample may not be indicative of their quality of play. A few fortuitous bounces here or there can be the difference between another ho-hum campaign or a special season. Randomness and other factors outside of our perception play a role in determining the standings. It would be fantastic if college football teams played 100 or even 1000 games. Then we could have a better idea about which teams were really the best. Alas, players would miss too much class time, their bodies would be battered beyond recognition, and I would never leave the couch. As it is, we have to make do with the handful of games teams do play. In those games, we can learn a lot from a team’s YPP. Since 2005, I have collected YPP data for every conference. I use conference games only because teams play such divergent non-conference schedules and the teams within a conference tend to be of similar quality. By running a regression analysis between a team’s Net YPP (the difference between their Yards Per Play and Yards Per Play Allowed) and their conference winning percentage, we can see if Net YPP is a decent predictor of a team’s record. Spoiler alert. It is. For the statistically inclined, the correlation coefficient between a team’s Net YPP in conference play and their conference record is around .66. Since Net YPP is a solid predictor of a team’s conference record, we can use it to identify which teams had a significant disparity between their conference record as predicted by Net YPP and their actual conference record. I used a difference of .200 between predicted and actual winning percentage as the threshold for ‘significant’. Why .200? It is a little arbitrary, but .200 corresponds to a difference of 1.6 games over an eight game conference schedule and 1.8 games over a nine game one. Over or under-performing by more than a game and a half in a small sample seems significant to me. In the 2024 season, which teams in the Big 10 met this threshold? Here are Big 10 teams sorted by performance over what would be expected from their Net YPP numbers.
Maryland was the sole Big 10 team that saw their actual record differ significantly from their expected record based on YPP. Off three consecutive bowl appearances (and victories), Maryland won just a single conference game in 2024. This was their worst conference performance since posting an identical 1-8 mark in Mike Locksley's first season (2019). The Terps were not unlucky in close games (1-1 conference record), but they did have the second worst in-conference turnover margin (-8) in Big 10 play. They were also a victim of fourth down variance. In conference play, they converted just 10 of 27 fourth down attempts (thats an extra seventeen 'hidden' turnovers). Meanwhile, Big 10 opponents converted 11 of 14 fourth down attempts. Despite my initial misgivings at his hiring, Locksley has built a solid mid-level Big 10 program in College Park and I expect the Terps be much more respectable in 2025. 

Worst Losses by Championship Game Participants
2024 introduced us to the brave new world of college football. No longer must a team play nearly flawless ball over three months. The introduction of the four team college football playoff a decade ago meant certain teams (i.e. traditional powers, usually in the SEC or Big 10) often got one mulligan. Now with the playoff at twelve, those teams now get (at least) two mulligans. Case in point, your 2024 champs, the Ohio State Buckeyes. Ohio State lost a tight game at Oregon in October, but were expected to have a shot at revenge against the Ducks in the Big 10 Championship Game. But then, in the final weekend of the regular season, Ohio State tripped over their own dicks in a shocking home loss to a decent, but flawed Michigan team. In any previous season, even the wacky 2007 edition, Ohio State would have been relegated to a meaningless New Year's Six Bowl or worse. But with the playoff committee tasked with finding twelve participants instead of four, Ohio State easily qualified, and proceeded to realize their potential by winning four consecutive games en route to the national title. They even exacted revenge on Oregon, albeit about a month later than most initially anticipated. I'm not implying this is a bad thing. Ohio State was one of the best college football teams in 2024. Its just that plenty of teams in college football's long history have arguably been the best team in a particular year, but lacked the opportunity to 'prove it on the field' after suffering one or more defeats over the course of the regular season. I expect in a half-decade, if not sooner, we'll adjust our internal thermostat and not think twice about a team that wins the title with two or perhaps even three losses. 

The team that Ohio State defeated in the national championship game also entered with a loss. Notre Dame famously lost at home to Northern Illinois in their home opener. The Huskies ended up being a bowl level MAC team, but the result was one of the more shocking upsets of the 2024 season. With both title game participants having at least one loss, it got me to thinking about which champion or runner up suffered the worst loss in the BCS/CFP era (since 1998). In order to access the severity of the loss, I included three factors: the venue (home, away, or neutral), the margin, and the opponent's end of season SRS ranking from College Football Reference. After conducting this research, eight teams really stood out to me. In reverse order, these are what I deem to be the eight teams with the worst losses entering their respective championship game. 
This year's Buckeyes are on the list primarily for the quantity of their losses more so than their quality. The Oregon loss is quite respectable coming on the road by a single point against an elite opponent. The Michigan loss was certainly a shock at the time, but it was close, and the Wolverines ended up having a solid SRS. 
LSU is also on the list primarily for losing twice. Had the Tigers dropped either one of these games and not both, they would be pretty reasonable losses for a title game participant. Both were close, against solid teams, and one even came on the road. 
This one is forgotten by a lot of folks thanks to what happened in the rematch in the SEC Championship Game, but Georgia got waxed by Auburn in Jordan Hare. The Tigers went on a 40-3 run after falling behind 7-0. 
This one happened in the Big 12 Championship Game, but was one of the most shocking results of the 2003 season. Oklahoma entered having won just a single game by fewer than two touchdowns all year and left allowing 35 consecutive points to a very good Kansas State team. 
Another early aughts Big 12 slaughter, but this was a week before the Big 12 Championship Game. Nebraska entered as the consensus number two team in the nation (behind Miami), having not won a game by fewer than ten points all season. This game was more competitive than the final score, as Nebraska was only outgained by 30 yards, but committed four turnovers to turn this into a laugher. 
Most of the previous teams on this list suffered a late loss that threatened to derail their title hopes. However, the 2014 Buckeyes got their bad loss out of the way early. In the second game of the season, Ohio State lost at home to a mediocre Virginia Tech team that ended up with a losing record in the ACC. The Buckeyes scored 21 points in this game, but would not score fewer than 31 in any of their remaining thirteen games on the way to their first national title since 2002. 
Another mostly forgotten game, that like the previous entry, happened early in the season. Florida State had lost just one ACC game in their first six seasons in the league, but scored a season low seven points and lost as a massive favorite against a team that would lose the following week to 2-9 Baylor. College football is wild sometimes. 
While the game was close, the venue and quality of opponent make this my choice for worst loss by a title game participant in the BCS/CFP era. Notre Dame is the only title game participant to loss to a non-power conference opponent. While the Huskies are a quality MAC program, their SRS ranking of 65th is the worst of any team to beat a conference title participant (second worst is 1998 NC State at 40th). 

What do you think? Do you agree with this list? Did I mess the order up or leave some worthy losses off entirely?

Thursday, February 13, 2025

2024 Adjusted Pythagorean Record: ACC

Last week we looked at how ACC teams fared in terms of yards per play. This week, we turn our attention to how the season played out in terms of the Adjusted Pythagorean Record, or APR. For an in-depth look at APR, click here. If you didn’t feel like clicking, here is the Reader’s Digest version. APR looks at how well a team scores and prevents touchdowns. Non-offensive touchdowns, field goals, extra points, and safeties are excluded. The ratio of offensive touchdowns to touchdowns allowed is converted into a winning percentage. Pretty simple actually.

Once again, here are the 2024 ACC standings.
And here are the APR standings with conference rank in offensive touchdowns, touchdowns allowed, and APR in parentheses. This includes conference games only with the championship game excluded.
Finally, ACC teams are sorted by the difference between their actual number of wins and their expected number of wins according to APR.
No ACC teams saw their actual record differ significantly from their APR, so we will move on to more pressing issues. 

A Brief History of Non-Conference Conference Games
One of the unfortunate consequences of conference expansion is that former conference rivals don't see each other as much as they used to. With some conferences roughly double the size they were thirty years ago, some teams are resorting to filling out their non-conference schedule with conference opponents. NC State and Virginia will do just that in 2025 and 2026. Being the curious type, I used my recent Stathead subscription (would recommend) to search the Sports Reference database for all such instances of non-conference conference games. They are listed below along with a brief narrative. I also included recent bowl games between conference opponents as that will be a more common occurrence with the expanded College Football Playoff. First though, the regular season matchups. 

Non-Conference Conference Games
Cal and Colorado played a non-conference game in Berkeley as members of the Pac-10 and Big 12 respectively in 2010. Cal dominated the Buffaloes in the final season of the Dan Hawkins era. Colorado, along with Utah, joined the Pac-10 (renamed the Pac-12) in 2011 with the return game in Boulder already on the schedule. The league left the game as is and counted it as a non-conference game. Cal won again, but this one was much closer. Had this game counted in the conference standings, it would not have impacted the league race. Both the Bears and Buffaloes finished with losing conference records and were not in contention for the league title. 
Before meeting in Winston-Salem in 2019, Wake Forest and North Carolina had played just once since 2012. The in-state rivals that played every season between 1944 and 2004 scheduled the first premeditated non-conference conference game. Wake won the 2019 edition. Had this been a legitimate conference game, it would not have significantly impacted the ACC race as both teams finished with identical 4-4 marks in the ACC. However, the return game two years later in Chapel Hill would have drastically impacted the conference race. Wake entered the game with an 8-0 record and the highest ranking in school history (10th). The Demon Deacons appeared to be on their way to a 9-0 start as they led 45-27 in the third quarter and were up two touchdowns entering the fourth. The Tar Heels scored 24 consecutive points to take a double digit lead and held on to win by three. Wake lost to Clemson a few weeks later, but won their other league games and represented the Atlantic Division in the ACC Championship Game. Had this game replaced one of Wake's other cross-division games, there would have been a three-way tie atop the Atlantic Division (Clemson, NC State, and Wake). I'm unsure how the conference would have broken this hypothetical tie, but it likely would have resulted in a different conference title matchup. 
After losing Oklahoma and Texas to the SEC, the Big 12 raided the Pac-12, adding Arizona, Arizona State, Colorado, and Utah to the league. Two of those former Pac-12 schools (Arizona and Utah) already had games with Big 12 schools on the books. Utah played Baylor in Waco in 2023 and the return game was already set for Salt Lake City in 2024. Meanwhile, Arizona was already scheduled to play another destruction of Wildcats in Manhattan. Arizona and Kansas State are set for the return game in Tucson in 2025. 
Navy joined the AAC in 2015 and their service academy rivals joined in 2024. Despite playing in the same conference, America's Game will retain its standalone spot in December after the conference championship game is contested. This author hopes to see the Black Knights and Midshipmen playing each other on back to back weekends in the near future. 

Postseason Games Between Conference Foes
Note this list is confined to the BCS/CFP era (since 1998), so the Orange Bowl after the 1978 season and any other postseason game happening prior to the modern era are not considered. 
This was a mostly forgotten game between two Mountain West also rans (combined 13-11 record entering the game) that was not even broadcast on traditional television. As least the game ended up being good, with Nevada scoring a late touchdown to win.
The 2011 BCS Championship Game was somewhat consequential as it not only delivered Nick Saban his third national title and denied Les Miles his second, it also set the stage for the creation of the College Football Playoff. The fourth edition of that College Football Playoff gave us a classic as Alabama defeated Georgia in overtime thanks to heroics from Tua Tagovailoa and DeVonta Smith. Georgia retuned the favor four years later to win their first national title in four decades.
This past season's Rose Bowl was a rematch of a regular season classic. The rematch was not quite as competitive as Ohio State raced out to a 34-0 lead and never looked back. 
Though it was not nearly as meaningful as this year's Rose Bowl, we must remember the Alamo Bowl. BYU won eleven games for the second time in five seasons and ended Heisman winner Travis Hunter's college career on a sour note. 

Thursday, February 06, 2025

2024 Yards Per Play: ACC

We are into February now. While real football is still far away, take solace in the fact that spring games start in less than a month. Let's reminisce about what happened in the ACC in 2024. 

Here are the 2024 ACC standings. 
So we know what each team achieved, but how did they perform? To answer that, here are the Yards Per Play (YPP), Yards Per Play Allowed (YPA) and Net Yards Per Play (Net) numbers for each ACC team. This includes conference play only, with the championship game not included. The teams are sorted by Net YPP with conference rank in parentheses.
College football teams play either eight or nine conference games. Consequently, their record in such a small sample may not be indicative of their quality of play. A few fortuitous bounces here or there can be the difference between another ho-hum campaign or a special season. Randomness and other factors outside of our perception play a role in determining the standings. It would be fantastic if college football teams played 100 or even 1000 games. Then we could have a better idea about which teams were really the best. Alas, players would miss too much class time, their bodies would be battered beyond recognition, and I would never leave the couch. As it is, we have to make do with the handful of games teams do play. In those games, we can learn a lot from a team’s YPP. Since 2005, I have collected YPP data for every conference. I use conference games only because teams play such divergent non-conference schedules and the teams within a conference tend to be of similar quality. By running a regression analysis between a team’s Net YPP (the difference between their Yards Per Play and Yards Per Play Allowed) and their conference winning percentage, we can see if Net YPP is a decent predictor of a team’s record. Spoiler alert. It is. For the statistically inclined, the correlation coefficient between a team’s Net YPP in conference play and their conference record is around .66. Since Net YPP is a solid predictor of a team’s conference record, we can use it to identify which teams had a significant disparity between their conference record as predicted by Net YPP and their actual conference record. I used a difference of .200 between predicted and actual winning percentage as the threshold for ‘significant’. Why .200? It is a little arbitrary, but .200 corresponds to a difference of 1.6 games over an eight game conference schedule and 1.8 games over a nine game one. Over or under-performing by more than a game and a half in a small sample seems significant to me. In the 2024 season, which teams in the ACC met this threshold? Here are ACC teams sorted by performance over what would be expected from their Net YPP numbers.
Syracuse significantly exceeded their expected record based on YPP while newcomer Cal underperformed. The college football regular season ended on November 30th. However, the College Football Playoff did not officially crown a champion until late in the evening on January 20th, nearly two full months later. Syracuse played just one game after finishing the regular season with an upset of Miami, a Holiday Bowl blowout against undermanned Washington State, so you may have forgotten the Orange closed the regular season on a three-game win streak and actually finished 20th in the final AP Poll. That was a great showing for the Orange in their first season under Fran Brown, but they were not quite as good as their record indicated. Go back and look at the per play numbers. The Orange had the second worst per play defense in the ACC (ahead of only Stanford). Syracuse finished 5-2 in one-score conference games (7-2 overall in such games). With Ohio State transfer Kyle McCord taking snaps, the Orange converted nearly 49% of their third down attempts on the season (eighth nationally). With McCord gone, I expect serious regression from the Syracuse offense in 2025. Meanwhile, Cal had a slightly positive per play differential, but won just two conference games. The Bears were 1-5 in one-score ACC games and were most unfortunate in fourth down variance. ACC opponents converted 18 of 23 fourth down attempts against the Bears (78%). Had they managed to kill a few more drives with stops on fourth down, the Bears first foray into the ACC would have gone much better. 

The Polls Got It Wrong
Heading into 2024, Florida State was the ACC favorite, at least as determined by the Stassen Preseason Consensus. The Seminoles were far from a prohibitive favorite, as some other magazines and projection systems picked Clemson or Miami to win the crown, but they were the consensus selection to repeat as ACC champs. That prediction ended up being about as accurate as a respected Iowa presidential poll. I'm not here to clown on the prognosticators. Florida State won the ACC in 2023 and it was reasonable to expect them to contend once again in 2024. However, the Seminoles not only finished with a losing conference record, they finished dead last in the ACC. And with conference expansion coupled with no divisions, that did not mean they finished eighth or ninth. No. They finished seventeenth! This was easily the biggest whiff by the preseason consensus over the past twenty years. But as we are want to do around here, let's take a stroll down memory lane and look at some other major misses by college football soothsayers. 
North Texas had won or shared the Sun Belt championship in the first four years of the conference's existence, so it was no surprise they were the consensus pick to win it again in 2005. The Mean Green won their Sun Belt opener, but won just a single game the rest of the way and finished tied for last. They would not post another winning campaign for the remainder of their time in the league (left after the 2012 season). 
Nebraska played in the Big 12 Championship Game in 2006. Why would they not represent the weaker North division once again in 2007? The Cornhuskers opened the season 4-1 with a non-conference loss to an elite Southern Cal team, but in a portent of things to come, allowed 40 points and nearly lost at home to Ball State. They closed the year on a 1-6 run and finished tied for last in the division. 
Auburn was actually tied with LSU as the consensus favorite to come out of the SEC West in 2008. Auburn had a hyped offensive coordinator and a head coach that couldn't lose to Alabama. That offensive coordinator was fired halfway through the season and the head coach is now the dumbest senator in US history (previous statement may be slightly hyperbolic, but not much). Also in 2008, UCF was coming off a Conference USA title, but their All-American running back was selected in the NFL Draft and the Knights struggled to score on their way to a disappointing finish. 
Kansas finished with a 20-6 combined record in 2007 and 2008. With attrition at Missouri, Kansas was the logical choice to serve as the Big 12 North's sacrificial lamb in the league's title game. Kansas opened the season 5-0, but dropped their final seven games. The losing streak coupled with allegations of player abuse ended the Mark Mangino era in Lawrence. 
Texas played in the BCS Championship Game in 2009, so even with the loss of Colt McCoy, it was time to reload in Austin. While he held on for a few more years after 2010, this was the beginning of the end for Mack Brown as an elite college coach (or at least coach of an elite college team). 
In their first ten years in the ACC, the Hokies posted a 62-18 conference record, so it was no surprise they were favored to appear in another ACC Championship Game in 2014 (albeit only slightly). Their 3-5 finish was not horrible, but with the general competitiveness of the ACC, they were tied for last in the Coastal.
Georgia Tech represented the Coastal in the 2014 ACC Championship Game and beat two SEC teams on their way to a top ten finish in 2014. They sputtered horribly in 2015, winning just a single league game. Although it did come in dramatic fashion
Between 2013 and 2015, Marshall won 33 games. That trend was expected to continue in 2016, but the Thundering Herd won just two league games that season. 
Fresno State played in back to back Mountain West Championship Game in 2017 and 2018. The Bulldogs were unable to make it three in a row as they finished tied for last in the West division despite beating eventual division champ Hawaii. Also in 2019, perennial MAC power Toledo posted their first losing conference record in a decade as they finished tied for last in the MAC West.
And finally, the creme de la creme. Florida State somehow finished below 16 other conference teams in 2024. Again, I am not throwing shade at those that predicted another Florida State conference title. Even the most pessimistic observers would not have predicted this level of futility. However, those in the prediction business will be hard pressed to whiff this badly ever again.