Thursday, May 29, 2025

2024 Adjusted Pythagorean Record: Sun Belt

Last week we looked at how Sun Belt teams fared in terms of yards per play. This week, we turn our attention to how the season played out in terms of the Adjusted Pythagorean Record, or APR. For an in-depth look at APR, click here. If you didn’t feel like clicking, here is the Reader’s Digest version. APR looks at how well a team scores and prevents touchdowns. Non-offensive touchdowns, field goals, extra points, and safeties are excluded. The ratio of offensive touchdowns to touchdowns allowed is converted into a winning percentage. Pretty simple actually.

Once again, here are the 2024 Sun Belt standings.
And here are the APR standings with conference rank in offensive touchdowns, touchdowns allowed, and APR in parentheses. This includes conference games only with the championship game excluded.
Finally, Sun Belt teams are sorted by the difference between their actual number of wins and their expected number of wins according to APR.
Arkansas State and Marshall were the only Sun Belt teams that saw their actual record differ significantly (difference of a game and a half or more) from their APR. The Red Wolves and Thundering Herd significantly exceeded their APR and they also exceeded their expected record based on Yards Per Play. We went over some reasons for that last week, so no need to rehash it here. 

Conference Championship Game, No Bowl
Marshall pulled off a rare feat in 2024. The Thundering Herd won the Sun Belt, but did not play in a bowl game. There were of course, some extenuating circumstances that precipitated their absence from bowl season. Their head coach took another job in what seemed like mere seconds after the Sun Belt Championship Game. His departure led to a staggering number of players entering the transfer portal. And their bowl opponent happened to be a very good triple option team. Marshall opted out of the Independence Bowl and became just the twelfth team team to participate in their conference title game and not participate in bowl season. The Herd and the other eleven are listed below. 
Marshall is even more rarified air as they join UAB in the pandemic impacted 2020 season as the only other conference championship game victor to sit out bowl season. The Blazers had been set to play South Carolina in the Gasparilla Bowl, but the Gamecocks withdrew due to an uptick in Covid-19 cases within the program and the game was canceled

You may notice that five teams in the preceding table have asterisks by their name. The reason? Those teams all faced Marshall in their respective conference title games. The Thundering Herd kept four consecutive MAC teams from appearing in a bowl by beating them in the conference title game. This was in an era when mid-major conferences only had one or two bowl tie-ins. They were also defeated by the aforementioned UAB Blazers in the 2020 Conference USA Championship Game

That will close out our 2024 YPP and APR recaps. Thanks for reading. I hope you learned a little something and were at least marginally entertained in the past four and a half months. If you are curious, the rest of our summer schedule is as follows. I'll be taking the month of June off, but will return the first Thursday in July with a breakdown of First Half Point Differential in the Group of Five. Two weeks later, we'll look at the same stat in the Power Four. Two or three weeks after that, I'll recap my annual Vegas trip, and then we should be within shouting distance of the regular season. During the season, every Thursday, I'll post my seven favorite picks against the spread. And before you know it, another year will have come and gone. Thanks as always for reading. I appreciate the handful of folks who keep returning year after year. See you in July!

Thursday, May 22, 2025

2024 Yards Per Play: Sun Belt

I know its hard to believe, but our time reviewing the 2024 season is nearly at an end. The final conference for us to look at is the Sun Belt. 

Here are the 2024 Sun Belt standings.
So we know what each team achieved, but how did they perform? To answer that, here are the Yards Per Play (YPP), Yards Per Play Allowed (YPA) and Net Yards Per Play (Net) numbers for each Sun Belt team. This includes conference play only, with the championship game not included. The teams are sorted by division by Net YPP with conference rank in parentheses.
College football teams play either eight or nine conference games. Consequently, their record in such a small sample may not be indicative of their quality of play. A few fortuitous bounces here or there can be the difference between another ho-hum campaign or a special season. Randomness and other factors outside of our perception play a role in determining the standings. It would be fantastic if college football teams played 100 or even 1000 games. Then we could have a better idea about which teams were really the best. Alas, players would miss too much class time, their bodies would be battered beyond recognition, and I would never leave the couch. As it is, we have to make do with the handful of games teams do play. In those games, we can learn a lot from a team’s YPP. Since 2005, I have collected YPP data for every conference. I use conference games only because teams play such divergent non-conference schedules and the teams within a conference tend to be of similar quality. By running a regression analysis between a team’s Net YPP (the difference between their Yards Per Play and Yards Per Play Allowed) and their conference winning percentage, we can see if Net YPP is a decent predictor of a team’s record. Spoiler alert. It is. For the statistically inclined, the correlation coefficient between a team’s Net YPP in conference play and their conference record is around .66. Since Net YPP is a solid predictor of a team’s conference record, we can use it to identify which teams had a significant disparity between their conference record as predicted by Net YPP and their actual conference record. I used a difference of .200 between predicted and actual winning percentage as the threshold for ‘significant’. Why .200? It is a little arbitrary, but .200 corresponds to a difference of 1.6 games over an eight game conference schedule and 1.8 games over a nine game one. Over or under-performing by more than a game and a half in a small sample seems significant to me. In the 2024 season, which teams in the Sun Belt met this threshold? Here are Sun Belt teams sorted by performance over what would be expected from their Net YPP numbers.
A quartet of teams in the Sun Belt saw their actual record differ significantly from their expected record based on Yards per Play. The trio of Arkansas State, Georgia Southern, and Marshall significantly exceeded their expected record while Georgia State underachieved. Arkansas State (4-1), Georgia Southern (2-1), and Marshall (3-1) all performed well in close conference games. All three were also on the positive side of fourth down variance. Arkansas State converted twelve of their fifteen fourth down attempts in league play. Georgia Southern (six of nine) and Marshall (six of ten) were good, but not quite as charmed as the Red Wolves on their fourth down conversions. Georgia Southern also stopped eight of their opponents' eleven fourth down attempts in Sun Belt play, generating an additional eight hidden turnovers. Meanwhile, Georgia State finished 1-3 in one-score conference games, had a negative in-conference turnover margin (-3), and converted just five of their eighteen fourth down attempts in Sun Belt action. Those fourth down failures represent thirteen hidden turnovers not accounted for in their already poor turnover margin. 

Dominated By Conference Opponents Part Deux
In last week's post on the SEC, we examined Mississippi State's horrendous conference season in 2024. The Bulldogs dropped all of their SEC games with each loss coming by double digits. I mentioned the Bulldogs were not the only FBS team to go winless in conference play in 2024 with each of their losses coming by double digits. Another team in the same state, Southern Miss, also managed that ignominious feat. The Golden Eagles were even worse relative to their competition than the Bulldogs. Southern Miss lost their eight Sun Belt games by more than 25 points per game. They lost to Louisiana-Lafayette in their conference opener by ten points and that represented their high water mark in league play. Southern Miss became the tenth non-power (non-BCS/Group of Five) team to finish winless in conference play with all of their losses coming by double digits in the BCS/CFP era (since 1998). The other nine teams are listed below along with their performance in the follow up season. 
The nine non-power teams improved more in the aggregate than their power conference brethren we examined last week (.257 conference winning percentage in the follow up season compared to .200 for power conference teams). This makes sense. Power conferences tend to have more strict tiers of power, while non-powers are more fluid in their hierarchy. 

You may have noticed a few asterisks in the previous table. That was intentional. Unlike Mississippi State, who retained their coach despite their poor conference performance, Southern Miss will have a new head coach in 2025. Will Hall was fired midway through the 2024 season after a 1-6 start. Reed Stringer was the interim coach and I suppose received a nice paycheck for his 'performance'. The Golden Eagles pulled off a coup by getting Charles Huff (not to be confused with Charlie Hough) from conference rival Marshall to be their new coach. Huff has been moderately successful in his four seasons as a head coach, even guiding the Thundering Herd to the Sun Belt title last season. The good news for Huff is that the previous teams to swap out coaches after a crash and burn conference season all improved by multiple games in the following season. 
It might be the equivalent of a dead cat bounce, but I expect at least modest improvement in Hattiesburg in 2025. The Golden Eagles may not qualify for a bowl, but I expect two or three Sun Belt wins after their harrowing conference performance last season.

Thursday, May 15, 2025

2024 Adjusted Pythagorean Record: SEC

Last week we looked at how SEC teams fared in terms of yards per play. This week, we turn our attention to how the season played out in terms of the Adjusted Pythagorean Record, or APR. For an in-depth look at APR, click here. If you didn’t feel like clicking, here is the Reader’s Digest version. APR looks at how well a team scores and prevents touchdowns. Non-offensive touchdowns, field goals, extra points, and safeties are excluded. The ratio of offensive touchdowns to touchdowns allowed is converted into a winning percentage. Pretty simple actually.

Once again, here are the 2024 SEC standings.
And here are the APR standings with conference rank in offensive touchdowns, touchdowns allowed, and APR in parentheses. This includes conference games only with the championship game excluded.
Finally, SEC teams are sorted by the difference between their actual number of wins and their expected number of wins according to APR.
I use a game and a half as a somewhat arbitrary standard to determine whether a team significantly over or underachieved relative to their APR. By that standard, Missouri significantly exceeded their APR while Mississippi State underachieved. Missouri also overachieved relative to their expected record based on Yards Per Play and we went over some reasons for that last week. Mississippi State cannot blame a poor record in close games for their underachievement (as we'll discuss in a moment). They did have a poor in-conference turnover margin (-6) and were unable to get teams off the field on fourth down. Conference opponents only had eleven fourth down attempts against the Bulldogs, but they converted on nine of them. 

Dominated by Conference Opponents
There was some bad football played in the Magnolia State in 2024. Two teams, Mississippi State, and Southern Miss finished winless in conference play with each of their losses coming by double digits, joining a rather ignominious club. We'll discuss the Bulldogs this week and transition to the Golden Eagles next week when we look at the Sun Belt. 

In one of last year's SEC recaps, we touched on teams that went winless in conference play while losing all their games by double digits. The Bulldogs are the tenth power conference team in the BCS/CFP era to 'accomplish' the feat. The Bulldogs finished 0-8, with their average margin of defeat coming by 17.75 points, and their closest loss was by ten points. Feel free to read last year's post to see how they compare to the other nine teams. I, of course, am more concerned about how they will perform in 2025. The table below lists the previous nine teams and how they fared in the season following their noncompetitive conference season. 
In the aggregate, the teams improved although they still tended to be quite bad, winning just a fifth of their conference games in the follow up season. Seven of the nine teams improved and four of nine improved by at least two wins. 

You may have noticed a few asterisks in the previous table. Teams with one asterisk had the same coach in both seasons and teams with two asterisks had the same coach in both seasons with both seasons representing the first two seasons the coach was with the team. Both of those situations apply to Mississippi State. 2024 marked Jeff Lebby's first season as head coach in Starkville and barring some Hugh Freeze levels of indiscretion this summer, he should be the head coach of the Bulldogs in 2025. For teams that held onto their coach after a bad season, the results are similar to the aggregate results for all teams.
Seven teams kept their coach despite seeing their team finish winless in conference play with each loss coming by double digits. Five of the seven teams improved though they were still quite bad in the aggregate. 

The bad news for Mississippi State is that the two teams that finished winless in conference play with all their losses coming by double digits under first year head coaches did not show much improvement at all in their second year. 
The sample size is quite small (Kevin Steele at Baylor in 1999 and Ron Zook at Illinois in 2005), but those two teams improved by just a single win the following season. Baylor went winless again at the turn of the millennium and Illinois managed just a single conference win in 2006. Mississippi State plays in the arguably the nation's toughest conference, so the deck is stacked against them when it comes to improving in 2025. 

Thursday, May 08, 2025

2024 Yards Per Play: SEC

The penultimate stop on our sojourn through the nine FBS conferences takes us south, home to the SEC. 

Here are the 2024 SEC standings.
So we know what each team achieved, but how did they perform? To answer that, here are the Yards Per Play (YPP), Yards Per Play Allowed (YPA) and Net Yards Per Play (Net) numbers for each SEC team. This includes conference play only, with the championship game not included. The teams are sorted by Net YPP with conference rank in parentheses.
College football teams play either eight or nine conference games. Consequently, their record in such a small sample may not be indicative of their quality of play. A few fortuitous bounces here or there can be the difference between another ho-hum campaign or a special season. Randomness and other factors outside of our perception play a role in determining the standings. It would be fantastic if college football teams played 100 or even 1000 games. Then we could have a better idea about which teams were really the best. Alas, players would miss too much class time, their bodies would be battered beyond recognition, and I would never leave the couch. As it is, we have to make do with the handful of games teams do play. In those games, we can learn a lot from a team’s YPP. Since 2005, I have collected YPP data for every conference. I use conference games only because teams play such divergent non-conference schedules and the teams within a conference tend to be of similar quality. By running a regression analysis between a team’s Net YPP (the difference between their Yards Per Play and Yards Per Play Allowed) and their conference winning percentage, we can see if Net YPP is a decent predictor of a team’s record. Spoiler alert. It is. For the statistically inclined, the correlation coefficient between a team’s Net YPP in conference play and their conference record is around .66. Since Net YPP is a solid predictor of a team’s conference record, we can use it to identify which teams had a significant disparity between their conference record as predicted by Net YPP and their actual conference record. I used a difference of .200 between predicted and actual winning percentage as the threshold for ‘significant’. Why .200? It is a little arbitrary, but .200 corresponds to a difference of 1.6 games over an eight game conference schedule and 1.8 games over a nine game one. Over or under-performing by more than a game and a half in a small sample seems significant to me. In the 2024 season, which teams in the SEC met this threshold? Here are SEC teams sorted by performance over what would be expected from their Net YPP numbers.
Two Tigers, Missouri and Auburn, saw their actual records differ significantly from their expected records based on Yards Per Play. Missouri exceeded their expected record thanks to a 4-1 record in one-score conference games. Missouri was absolutely destroyed in their other two league losses, falling to Texas A&M and Alabama by a combined 65 points while being outgained by more than four yards per play! For Auburn, their underachievement was a combination of several factors. The Tigers from The Plains were 1-2 in one-score conference games, had a slightly negative in-conference turnover margin (-1), and struggled in the kicking game (made eight of seventeen field goal attempts in SEC play). However, their biggest issues was scoring in the red zone. Auburn made 24 red zone trips in their eight SEC games, and scored just eight touchdowns on those trips!

Outliers
Without my cajoling, you probably noticed there seemed to be a large disconnect between the Net YPP numbers and conference record for both Auburn and Missouri. Auburn's Net YPP was greater than 1.00, yet they finished with a losing record. Meanwhile, Missouri's Net YPP was less than -1.00, yet they finished with a winning conference record. Both occurrences are quite rare. Auburn is one of thirteen power conference (BCS/Power 5/4) teams to finish with a .500 or worse conference record despite outgaining their league opponents by at least one yard per play since 2005. Meanwhile, Missouri is one of eleven power conference teams to finish with a .500 or better conference record despite being outgained by their league opponents by at least one yard per play since 2005. Let's look at the company these two teams are keeping, starting with Auburn. 
Outside of the pandemic shortened 2020 season, Auburn is one of only five power conference teams to outgain their league opponents by at least one yard per play and finish with a losing conference record. 

And now the teams Missouri most closely resembles. 
The Tigers, along with their former Big 12 conference rival Kansas State (Wildcats did it twice), are the only power conference teams to be outgained by their league opponents by at least one yard per play and finish with a winning conference record. 

Can we learn anything from those other outliers regarding what potentially awaits Auburn and Missouri in 2025? And can we use it make actionable wagers? The table below reveals what happened to the power conference teams that were .500 or worse despite outgaining their conference opponents by at least one yard per play.
In the aggregate, those previous eleven teams improved, though not by as much as I would have expected. Their winning percentage improve by about .081, or a little more than half a win in an eight or nine game conference schedule. Less than half (five of eleven) saw their conference record improve the next season, while three stayed the same, and an additional three actually declined. The three that declined were coached by Ron Zook, Houston Nutt, and Mike Locksley respectively, so you may draw some additional conclusions there. That being said, using history as a guide, improvement is definitely not guaranteed. 

Now let's look at the teams in a similar situation to Missouri. 
Once again, in the aggregate, the previous ten teams declined. On average, they declined by about .150, or more than a full win. In several cases, those .500 records built on poor per play numbers were portents of looming disaster. Three teams, Auburn, Stanford, and Vanderbilt declined by at least three games the following season. A select few teams did manage to improve, although in total, seventy percent of the teams saw a decline in their conference winning percentage the following season. 

So we can reasonably expect modest improvement (though not guaranteed) at Auburn in 2025 and at least modest decline at Missouri. Unfortunately, those expectations are right in line with the market. FanDuel currently has over/under win totals for power conference teams and both Auburn and Missouri have their total set at 7.5. At 6.5 for Auburn, I would happily take the over and at 8.5 for Missouri, I would happily take the under. Since the market seems to be pretty sharp on the win totals, I would instead consider taking a flyer on an Auburn SEC title at 30-1 odds and look for alternative win totals on Missouri (6.5 or 5.5) and take the under at better odds. Modest improvement and modest decline is the most likely result for Auburn and Missouri, but since there was such dissonance between their performance and actual records last season, I think getting longer odds on massive improvement or massive decline is the better betting option in 2025. 

Thursday, May 01, 2025

2024 Adjusted Pythagorean Record: Mountain West

Last week we looked at how Mountain West teams fared in terms of yards per play. This week, we turn our attention to how the season played out in terms of the Adjusted Pythagorean Record, or APR. For an in-depth look at APR, click here. If you didn’t feel like clicking, here is the Reader’s Digest version. APR looks at how well a team scores and prevents touchdowns. Non-offensive touchdowns, field goals, extra points, and safeties are excluded. The ratio of offensive touchdowns to touchdowns allowed is converted into a winning percentage. Pretty simple actually.

Once again, here are the 2024 Mountain West standings.
And here are the APR standings with conference rank in offensive touchdowns, touchdowns allowed, and APR in parentheses. This includes conference games only with the championship game excluded.
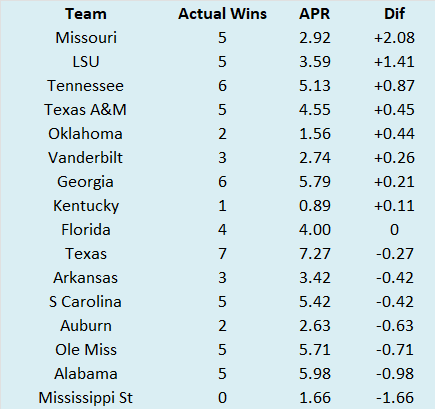
Finally, Mountain West teams are sorted by the difference between their actual number of wins and their expected number of wins according to APR.
Boise State and Nevada were the Mountain West teams that saw their actual record differ significantly from their APR. The Broncos significantly exceeded their APR while the Wolfpack underachieved. Both teams also over and underachieved relative to their expected record based on Yards Per Play and we went over some reasons for that last week. 

Using the Preseason AP Poll to Handicap College Football Playoff Games
Frequent readers of this blog (if any) know the value of using the preseason AP Poll to handicap both conference title games in college football and the NCAA Tournament in college basketball. Could this proxy for talent also be used to handicap College Football Playoff games? Let's find out. 

Before we get to the College Football Playoff, I wanted to look at one of the more hated ranking systems in college football, the Bowl Championship Series, or BCS. If you weren't a college football fan in this era, there are some great reads on the subject but I'll summarize it in a few short sentences. The BCS was designed to pit the two highest rated teams in the BCS against each other for the national championship. The methodology was quite reactionary changing nearly every season based on previous controversies and never being forward thinking. But it was an improvement on not having the top two teams play each other because of traditional bowl tie-ins

In BCS bowl games, of which there were initially four (Fiesta, Orange, Rose, and Sugar) and later five (BCS Championship Game), the participants were usually motivated. Even if they were not playing for the national championship, it was still a prestigious bowl game and opting out was never really an option. In the sixteen seasons of the BCS era (1998-2013) there were 25 BCS bowl games pitting a team that was ranked in the preseason AP Poll against a team that was unranked in the preseason AP Poll. There were also thirteen BCS bowl games pitting a team that was ranked in the preseason top ten of the AP Poll against a team that was unranked in the preseason AP Poll. The table below summarizes how those games played out both straight up and against the spread (ATS). 
The preseason poll was a solid predictor of success both straight up and ATS. Preseason top 25 teams won 68% of their games against teams that were unranked in the preseason AP Poll and also covered the spread more than 62% of the time. Preseason top ten teams performed at roughly the same level, winning 69% of their games and covering just under 62% of the time. 

Once the BCS ended, the College Football Playoff took its place. Instead of two teams vying for the national title, four teams were selected for a mini-tournament to crown the champion. The two semi-final games rotated among six prestigious bowl games now deemed the New Year's Six. The Cotton and  Peach joined the Fiesta, Orange, Rose, and Sugar to constitute this new amalgamation of college football greatness. The bowls that were not hosting the semi-finals staged glorious exhibitions. There were eighteen non-playoff New Year's Six bowl games contested between a team that was ranked in the preseason AP Poll and one that was not, There were nine such games involving a preseason top ten team and one that was unranked in the preseason AP Poll. The table below again summarizes how those games played out both straight up and against the spread (ATS). 
For New Year's Six games, you would have been better off flipping a coin. Preseason top 25 teams won just half the time against teams that were unranked in the preseason AP Poll and covered under 40% of the time. Preseason top ten teams did not fare any better, winning less than half the time and covering just a third of the time. Why the sudden change? ESPN bombarded the air waves with commercials and coverage of the College Football Playoff. If you weren't in the playoff and were merely a top ten team, you might as well not even participate in the sport. I don't think its a stretch to say motivation was an issue, particularly for teams that started with playoff aspirations (ranked in the top 25 or top ten of the preseason AP Poll) when they ended the season in bowl games that were not the College Football Playoff. The College Football Playoff era also coincided with the beginning of opt outs. If a team didn't qualify for the semi-finals, then a likely early round draft pick might sit out rather than risk injury in a 'meaningless' bowl game. 

What about the four-team College Football Playoff? In its ten years of existence, only two teams that were unranked in the preseason AP Poll qualified for the College Football Playoff. Those two teams played three games. The results are listed below. 
The sample size is small, but teams that were ranked in the preseason AP Poll won two of three games against preseason unranked teams both straight up and ATS. The two victories came by a combined 81 points and the lone loss came by six, so the teams ranked in the preseason AP Poll were quite dominant in their collective performances. 

The four-team College Football Playoff is a thing of the past. The playoff currently invites a dozen teams and seems more likely than not to expand in the near future. In the first year of the expanded College Football Playoff, eight of the twelve participants were ranked in the preseason AP Poll and six of twelve were ranked in the preseason top ten of the AP Poll. The four teams that were unranked in the preseason AP Poll that were selected for the College Football Playoff were Arizona State, Boise State, Indiana, and SMU. The below summarizes their performance in the College Football Playoff. 
All four teams entered as sizable underdogs against teams that were ranked in the top ten of the preseason AP Poll. All four lost, with three of the losses coming by double digits. Arizona State was the lone team that was unranked in the preseason AP Poll that covered as an underdog in their playoff game. 

The expanded College Football Playoff gives automatic bids to the five highest rated conference champions and awards seven at-large bids. With three times the number of playoff teams (for now), we are likely to see at least one or two teams qualify for the postseason that were not ranked in the preseason AP Poll. One season does not a trend make, but based on the history of teams that were ranked in the preseason AP Poll taking on teams that were unranked in the preseason AP Poll in 'meaningful' games (conference title games, BCS games, and previous College Football Playoff games), those preseason unranked teams might be a good candidate to fade even if they are massive underdogs.