Happy NFL
Draft Day to all who celebrate. Seven conferences down, three to go. Hard to believe we are approaching the end of our season reviews. That of course means the arduous and long offseason is about halfway over. This week we stay out west and examine the Pac-12.
Here are the 2022 Pac-12 standings.
So we know what each team achieved, but how did they perform? To answer that, here are the Yards Per Play (YPP), Yards Per Play Allowed (YPA) and Net Yards Per Play (Net) numbers for each Pac-12 team. This includes conference play only, with the championship game not included. The teams are sorted by Net YPP with conference rank in parentheses. 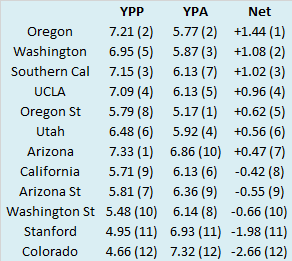
Southern Cal significantly overachieved relative to their YPP numbers while Arizona and Cal underachieved. Southern Cal was 4-1 in one-score conference games, but the biggest difference between their actual and expected record was probably their absurd turnover margin. The Trojans committed just four turnovers in their nine regular season Pac-12 games and their in-conference turnover margin of +14 was tops in the league. Meanwhile, the Cal Bears finished 1-4 in one-score conference games, dooming them to a third consecutive losing season. Arizona actually finished 2-1 in one-score conference games and posted the league's best per play offense. So why was there such a disconnect between their actual and expected record? Its kind of a mystery. The Wildcats had a negative in-conference turnover margin (-6), but it wasn't especially bad. They converted less than half their fourth downs in conference play (seven of fifteen), but that percentage is hardly terrible. Similarly, Pac-12 opponents converted more than half their fourth down attempts against the Wildcats, but they weren't exceptional (nine of sixteen). The little things conspired against the Wildcats and as we'll see in a moment, their conference record was historical, considering how well their offense played.
Taking Offense
In 2010, Chip Kelly led the Oregon Ducks to the BCS Championship Game with an offense that led the Pac-10 by averaging 6.62 yards per play in conference action. Twelve seasons later, his 2022 UCLA team averaged 7.09 yards per play. That number was only good for fourth place! The 2022 Pac-12 featured quite a few exceptional offenses. In fact, it was the first BCS/Power Five conference to have four teams average north of seven yards per in conference play. I mentioned a few lines up that Arizona's conference record was an historical outlier, at least relative to their offensive output. Here's what I mean. Since 2005, 48 teams have averaged at least seven yards per play over the course of their conference schedule. The other 47 teams combined to finish 323-65 in their respective leagues. That's roughly seven and a half wins in a nine-game conference schedule like the Pac-12 currently plays. Arizona finished 3-6 and in the process became just the sixth team to finish .500 or worse in conference play while averaging at least seven yards per play. They also became just the second to finish with a losing record.


No comments:
Post a Comment