Six conferences down, four to go. After spending the first three months of our reviews in the south, eastern, and midwestern parts of the continental United States, we follow
Horace Greeley's advice and head west to a conference that saw a third of its membership win ten games in 2021.
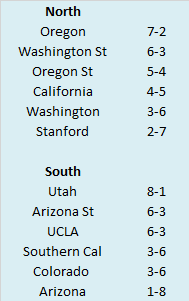
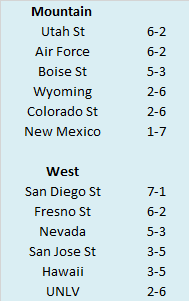
Here are the 2021 Mountain West standings.
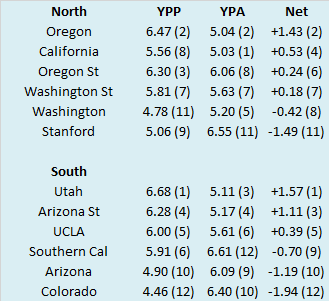
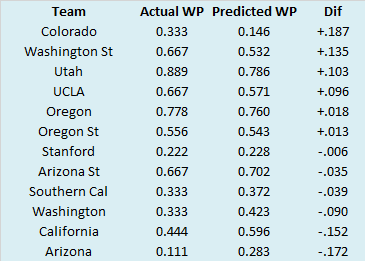
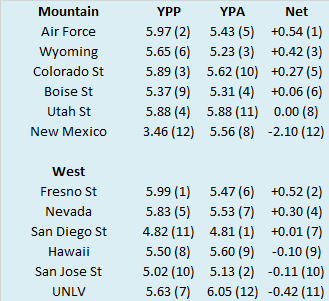
So we know what each team achieved, but how did they perform? To answer that, here are the Yards Per Play (YPP), Yards Per Play Allowed (YPA) and Net Yards Per Play (Net) numbers for each Mountain West team. This includes conference play only, with the championship game not included. The teams are sorted by division by Net YPP with conference rank in parentheses. College football teams play either eight or nine conference games. Consequently, their record in such a small sample may not be indicative of their quality of play. A few fortuitous bounces here or there can be the difference between another ho-hum campaign or a special season. Randomness and other factors outside of our perception play a role in determining the standings. It would be fantastic if college football teams played 100 or even 1000 games. Then we could have a better idea about which teams were really the best. Alas, players would miss too much class time, their bodies would be battered beyond recognition, and I would never leave the couch. As it is, we have to make do with the handful of games teams do play. In those games, we can learn a lot from a team’s YPP. Since 2005, I have collected YPP data for every conference. I use conference games only because teams play such divergent non-conference schedules and the teams within a conference tend to be of similar quality. By running a regression analysis between a team’s Net YPP (the difference between their Yards Per Play and Yards Per Play Allowed) and their conference winning percentage, we can see if Net YPP is a decent predictor of a team’s record. Spoiler alert. It is. For the statistically inclined, the correlation coefficient between a team’s Net YPP in conference play and their conference record is around .66. Since Net YPP is a solid predictor of a team’s conference record, we can use it to identify which teams had a significant disparity between their conference record as predicted by Net YPP and their actual conference record. I used a difference of .200 between predicted and actual winning percentage as the threshold for ‘significant’. Why .200? It is a little arbitrary, but .200 corresponds to a difference of 1.6 games over an eight game conference schedule and 1.8 games over a nine game one. Over or under-performing by more than a game and a half in a small sample seems significant to me. In the 2021 season, which teams in the Mountain West met this threshold? Here are Mountain West teams sorted by performance over what would be expected from their Net YPP numbers. There was a lot of over and underachievement in the Mountain West in 2021. The two teams that faced off in the
Mountain West Championship Game, San Diego State and Utah State, significantly overachieved, while a pair of teams that finished with a combined 4-12 conference record (Colorado State and Wyoming) significantly underachieved. San Diego State and Utah State finished a combined 8-0 in one-score conference games, but they went about winning those games in vastly different ways. San Diego State brought a smile to the octogenarian football fans by relying on their defense (best per play defense in the conference) and special teams (
Matt Araiza punted brilliantly and kicked field goals adequately). Meanwhile, Utah State aired it out with
transfer quarterback Logan Bonner and managed to win a conference title despite the second worst per play defense in the Mountain West. Colorado State and Wyoming cannot pin their underachievement entirely on close game misfortune. While the Rams and Cowboys combined for an 0-3 mark in one-score Mountain West games, my abacus indicates they still went just 4-9 in multi-score Mountain West games. Colorado State's per play numbers are buoyed by
their game against New Mexico. The Rams won that game by 29 points, but outgained the Lobos by an absurd four yards per play. In their other seven Mountain West games, the Rams were outgained by 0.18 yards per play (5.93 to 6.11) which still means they underachieved, as they only managed one victory in those seven games. However, that level of underachievement is not nearly as drastic. For Wyoming, the culprit was an inconsistent offense. The Cowboys scored 14 or fewer points in five of their eight Mountain West games (all losses), but scored 96 total points in the other three (of which they won two). A more consistent offense would have resulted in an extra victory or two in Laramie.
Mediocre Conference Championship Games
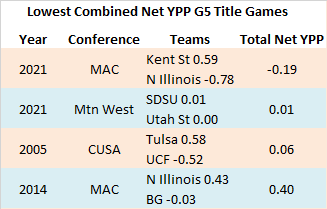
The two teams that played in the Mountain West Championship Game last season finished seventh and eighth respectively in Net YPP. The Aggies and Aztecs were not bad, but they were also probably not the best teams in the Mountain West last season. How do they compare to previous championship game participants historically? Since 2005, among Group of Five teams, they have the second smallest combined Net YPP.
Utah State and San Diego State were beaten by another title game from 2021. However, they can take solace as they have the lowest Net YPP of any title game where neither participant entered with a negative Net YPP.
While the MAC and Mountain West produced historic conference title games in 2021 (at least in terms of cumulative Net YPP), this phenomenon is not limited to so called mid-majors. Power Five leagues have featured a few battles of mediocrity as well.
The ACC has been a habitual offender, with the
2008 incarnation grabbing the top spot (that season only one team finished with a conference record more than one game from .500). And don't think we can't see you there SEC. Tennessee's
last conference title appearance came in a season when they were actually outgained and outscored in conference play!

.png)
.png)
.png)


.png)
.png)
.png)


