Thursday, March 28, 2019

Rumors of the Pac-12's Demise Have (Probably) Been Greatly Exaggerated

The Pac-12 has been the butt of a lot of jokes lately. Their football championship game had attendance numbers commensurate with a middle school JV game in Iowa, their football champion has missed the College Football Playoff two years running, their network appears to be going the way of the Prevue Channel (or the go-round channel as my mother calls it), and they may have been in real danger of sending a single team to the NCAA tournament this year. Fortunately, the Pac-12 was able to coax three bids to the tourney after Oregon won four games in four days to grab the automatic bid. I’m not here to suggest ways the Pac-12 can improve its championship game (move it out of Santa Clara), opine on when the conference will land a playoff bid, or offer advice on how to improve the Pac-12 Network, but I will give Pac-12 hoops fans reasons for optimism heading into 2020.

While college football has five ‘Power Conferences’, college basketball has six (and another two pseudo power conferences). Read my post from two years ago for some more background and justification on this (its really good!). Those six conferences (ACC, Big East, Big 10, Big 12, Pac-12, and SEC) account for the majority of at-large bids to the NCAA tournament. How many bids has each conference produced over the past 19 years? Glad you asked. The total number of NCAA tournament bids (at-large and automatic) for each power conference are listed below along with an average number of bids per season.
The Big East leads all power conferences with an average of six and a half tourney bids per season. The Big 10, Big 12, and ACC are bunched closely together and have received almost six bids per season, while the SEC has received about five per season and the Pac-12 is last at about four and a half. Alright, so things aren’t looking great for the Pac-12 thus far, but let’s come at this from another angle. Obviously a team that receives a number one seed in the NCAA tournament has been more successful than a team that receives a six seed. In the interest of rewarding better seeds, we’ll award what I have deemed 'seed points' for each tournament bid. A one seed receives sixteen seed points, a two seed receives fifteen seed points, and so on until the bottom of the bracket, where a sixteen seed receives one seed point. Using this methodology, how do the power conferences stack up?
Once again, the Big East is on top, receiving about 75 seed points on average per year. The ACC is a notch below with 70, the Big 12 and Big 10 are close together with 67 and 66 respectively, the SEC is further down the list with 55, and the Pac-12 again brings up the rear with 47. This just seems to further illustrate the point that the ostensible 'conference of champions' has struggled for quite some time. However, I think we need to make one more adjustment. Conference composition has changed a great deal since 2001. In 2001, the ACC had nine basketball playing members. Today, the conference has fifteen. That represents a 67% increase in membership size. To adjust for fluctuating membership size, let’s divide the total number of NCAA tournament bids for each conference by the average size of each conference over this 19 year period. Doing this gives us an average percentage of teams that qualify for the NCAA tournament for each conference.
When we make this adjustment, the Big 12 reigns supreme as on average, more than half of its member schools qualify for the NCAA tournament. The Big 10, Big East, and ACC are all just below 50%, and while the Pac-12 still rates low in this category, a new conference brings up the rear. A similar thing happens when we divide seed points by the average membership size for each conference.
The Big 12 is again tops by this measure with the ACC, Big East, and Big 10 finishing close together. The SEC and Pac-12 are virtually tied at the bottom of the standings. However, as I mentioned in the opening paragraph, there is hope for Pac-12 fans, and they can look to their neighbors as the bottom of this ranking, the SEC, for proof. Scroll back up and look at the first and second table. I’ll wait. Between 2013 and 2016, the SEC received a total of 14 NCAA tournament bids. In three of those seasons (2013, 2014, and 2016), they received just three bids. They also received the fewest seed points of any power conference in three of those four seasons. Yet, in the past two seasons, the SEC has secured fifteen bids to the NCAA tournament while ranking second and third in total seed points. How were they able to do this? They decided they wanted to be good and basketball. They threw money at the problem and hired good coaches. Since the end of the 2013-2014 season, six SEC schools have hired coaches with previous (successful) power conference head coaching experience and currently seven of the fourteen schools have a head coach with previous power conference head coaching experience (and this number doesn’t include John Calipari at Kentucky). If you allocate a few additional resources, success seems to follow. For further proof that the SEC is serious about basketball, look no further than the unemployment line where moderately successful head coaches just lost their jobs. Bryce Drew was fired at Vanderbilt after three seasons and one NCAA appearance. Maybe scratch him from the moderately successful list since the Commodores did finish 0-18 in SEC play this season. Mike Anderson was fired at Arkansas after three NCAA appearances in the last five seasons. Avery Johnson, a successful former NBA coach (and player) was let go by Alabama one season after making the NCAA tournament. Billy Kennedy was fired by Texas A&M despite two Sweet 16 appearances in the past four seasons. The SEC is serious about basketball now.

The ACC will never be the SEC’s equal in football, but the conference has gotten serious about competing in the sport. Clemson has won two of the last three college football national titles (and the conference as a whole has won three of six). Similarly, the SEC will probably not become the preeminent college basketball conference, but they are in much better shape than they were five years ago. Circling back around to the Pac-12, UCLA (arguably the top job in the conference) will hire a head coach in the coming weeks. A return to relevancy can be as simple as making the right hire in Los Angeles. The harder places to win in the conference (Colorado, Oregon State, and Utah) already have good coaches. Imagine if the school with a great location and history did the same?

Monday, March 18, 2019

2019 Bracket Advice: Don't Make Houston or Texas Tech Your Final Four Sleeper

While this is primarily a college football blog, around March or April over the past two years, I have deviated from the offseason script and penned a few college basketball pieces. Two years ago, I looked at how football expansion was making the March experience worse for mid-majors and last year, I examined college basketball tiers. Those posts both came out around Final Four weekend, but this year, I want to help you fill out your bracket. This post will point out some teams you should probably avoid christening as Cinderellas when you make your bracket picks. Next week, I’ll take a look at the ebbs and flows of at-large bids in the power conferences and hopefully talk Pac-12 fans down from bridges and overpasses. After that, we’ll resume football-centric posts and continue our slog through the ten FBS conferences with a look back at the MAC. As always, thanks for reading.

Which college basketball poll is more accurate: the preseason AP poll or the one put out mere days before the tournament starts? If you guessed the most recent poll, you are a moron you would be incorrect. Despite having a season’s worth of data, the final poll of the season is less accurate than the preseason poll in terms of identifying your national title contenders. Other researchers have written about this phenomenon and why it exists, so I won’t steal their thunder. However, I did conduct some research of my own in an attempt to identify teams that are more likely to be upset in the early rounds of the tournament. Read on for my analysis.

In 2001, the NCAA tournament expanded to 65 teams by adding a play-in game on the Tuesday before the real tournament starts. The play-in game pitted the two lowest rated teams in the field with the winner advancing to face prohibitive odds against a number one seed. While I dislike the play-in game and its successors, three other play-in games that were added when the field expanded to 68 teams in 2011, it is a nice arbitrary demarcation date. With that arbitrary date in mind, I decided to examine every tournament beginning with 2001. As the year is currently 2019, that means eighteen tournaments have been played since the field expanded. In those eighteen tournaments, there have been 171 teams to take the court while ranked in the most recent AP poll (and final as the AP does not vote on teams after the tournament) that were not ranked in the preseason AP poll. To determine how those teams fared in the tournament, I conducted a rudimentary examination of their expected number of wins based on their seed. For example, a number one seed is expected to win their quadrant of the bracket, so their expected number of wins would be four. Were they to lose in the first round (as Virginia famously did last season), they would finish four wins short of expectations. If they lost in the second round, they would finish three wins short and so on. As I mentioned, this analysis is very basic and ignores things like quality of opponent. When Virginia was vanquished in the first round, it made things much easier for the other teams in their quadrant, but that is not taken into account here. In addition, this analysis is only concerned with winning a quadrant (or region) of the bracket and advancing to the Final Four.

So how did those teams perform? Collectively, those 171 teams won about four tenths of a game less than would be expected based on their seed. While four tenths of a win may not sound like much, it means those teams are not living up to their seed in the aggregate. In addition, nearly half of those teams (85) finished at least one game worse (i.e. lost at least one round early) than would be expected based on their seed. Around 30% of those 171 teams (52) won exactly as many game as expected based on their seed and only 20% (34) performed above what would be expected. Those results are summarized in the table.
Still not convinced? Wait, there’s more. Since 2001, 91 teams seeded sixth or better have lost in the first round (about five per tournament on average). Of those 91 teams, 36 (nearly 40%) were ranked in the final AP poll despite not being ranked in the preseason AP poll. Those 36 teams are listed chronologically below. Relive your best (or worst March memories).

I’m not done yet. Since 2001, 56 teams seeded third or better have lost in the second round (about three per tournament). Of those 56 teams, 21 (about 38%) were ranked in the final AP poll despite not being ranked in the preseason AP poll. Once again, here they are. 
I try to be transparent around here, so I will point out the success stories of teams that entered the tournament ranked despite not appearing in the preseason poll. Six teams (out of 171) advanced to the Final Four. They are listed below along with the number of future NBA players on their respective teams.
Every team had at least two future NBA players (Michigan has an asterisk as some additional players from their 2018 runner-up squad may eventually play in the NBA) on their roster and some (looking at you Florida) had an embarrassment of riches. Obviously, the exception to this rule is if a team has a decent amount of future NBA talent, the fact they were not ranked in the preseason poll may not matter as much.

Hopefully I’ve convinced you that currently ranked teams that did not appear in the preseason poll are not good bets to go a long way in March (provided they don’t have a lot of NBA talent). But who fits the bill this year? Here are all the teams ranked in the most recent poll that were not ranked in the preseason poll along with their seed.
Texas Tech is the lone member of this group with a player likely to be drafted in June. Wofford's Fletcher Magee, Houston's Corey Davis, and Wisconsin's Ethan Happ may wind up on an NBA roster, but this group of teams is not brimming with NBA talent. I'm not implying they are all going to lose in the first round, but I would advise against predicting them to exceed the expectations associated with their seed.

Hopefully this analysis helps you win your bracket pool. If so, feel free to send me a percentage of your winnings. If not, well you shouldn’t believe everything you read on the internet.

Thursday, March 14, 2019

2018 Adjusted Pythagorean Record: Conference USA

Last week we looked at how Conference USA teams fared in terms of yards per play. This week, we turn our attention to how the season played out in terms of the Adjusted Pythagorean Record, or APR. For an in-depth look at APR, click here. If you didn’t feel like clicking, here is the Reader’s Digest version. APR looks at how well a team scores and prevents touchdowns. Non-offensive touchdowns, field goals, extra points, and safeties are excluded. The ratio of offensive touchdowns to touchdowns allowed is converted into a winning percentage. Pretty simple actually.

Once again, here are the 2018 Conference USA standings.
And here are the APR standings sorted by division with conference rank in offensive touchdowns, touchdowns allowed, and APR in parentheses. This includes conference games only with the championship game excluded.
Finally, Conference USA teams are sorted by the difference between their actual number of wins and their expected number of wins according to APR.
I use a game and a half as a line of demarcation and by that standard, no team significantly exceeded their APR. Two teams did finish at least a game and a half below their APR, but Florida Atlantic and UTEP also failed to live up to their expected record based on YPP and we went over some reasons why last week.

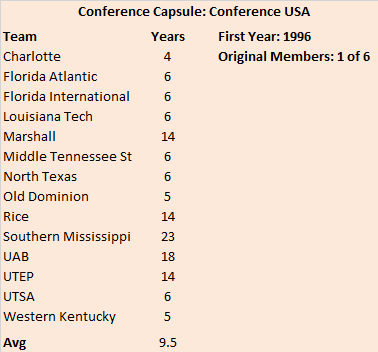
The Shifting Membership of Group of Five Conferences
Over the past decade or so, conference affiliation has been fluid. Massive realignment shifts at the top level of college football have caused significant aftershocks at the lower levels of the sport. Look no further than Conference USA for evidence of this. Despite barely being old enough to drink (the league began playing football in 1996), only one of the original six founding members is still in the conference. With that in mind, I decided to see just how stable conference membership is at the Group of Five level. Is Conference USA unique in its shifting membership or is this par for the course for the other mid-major conferences? To find out, I looked at the current (football playing) makeup of the four senior Group of Five conferences (I ignored the American as it was only founded in 2013) and calculated how many years the average team had been a continuous member as well as how many of the original members were remaining. I’ll go through each conference one by one starting with the most stable (defined as having the longest tenured average member).
Founded in 1962, the MAC is easily the oldest mid-major conference and has by far the longest-tenured average member. Nine of the twelve teams have been in the conference for at least forty years and all twelve have spent at least two decades as a member of the Big 10’s little brother. Note that the average membership length would be even greater if I included both tenures of Northern Illinois. The Huskies joined the MAC in 1975 and played for eleven seasons before leaving after the 1985 campaign. They were vagabonds for another eleven season, playing as an independent and as a member of the Big West before rejoining the MAC in 1997. Also note that six of the original seven MAC teams are still in the conference. Marshall was a founding member of the conference in 1962 and stayed for eight season before becoming an independent in 1970. The Herd later rejoined (and dominated) the MAC when they made the jump from I-AA (now FCS) in 1997.
Finishing with an average membership length merely three decades short of the MAC’s, the Mountain West is up next. The conference will be celebrating its 20th anniversary in 2019 and six of the original eight founding members are still there. The other two, TCU and Utah, moved up to Power Five conferences several years ago. Outside of those original six, the other half of the conference is filled with relative newcomers. Boise joined in 2011, Fresno State, Hawaii, and Nevada joined in 2012, and San Jose State and Utah State rounded out the membership in 2013.
The Sun Belt began sponsoring football in 2001, but only three of the original seven members are still in the conference. Idaho now plays football at the FCS level while New Mexico State has been banished to the waste land of independent football and Middle Tennessee and North Texas are now members of Conference USA. The Sun Belt has served as a landing spot for teams looking to get a slice of that FBS money. Appalachian State, Coastal Carolina, Georgia Southern, Georgia State, South Alabama, and Texas State have all either moved up from the FCS or started their football programs from scratch in the past decade.
Southern Miss is the elder statesman of Conference USA. The other five founding members are all in the ACC (Louisville) or the American (Cincinnati, Houston, Memphis, and Tulane). Outside of Southern Miss, only four other teams have been in the conference more than a decade (Marshall, Rice, UAB, and UTEP). The other members either graduated from the Sun Belt (FAU, FIU, Middle Tennessee, North Texas, and Western Kentucky), escaped the WAC before it imploded (Louisiana Tech and UTSA), or started their football programs in the last decade (Charlotte, Old Dominion, and UTSA again).

Despite being the second-oldest surviving mid-major conference (RIP WAC), Conference USA is the second youngest in terms of average length of membership (behind the six-year old American). Will the conference survive another round of realignment or become a footnote in history like its spiritual predecessor, The Metro? Only time will tell.

Thursday, March 07, 2019

2018 Yards Per Play: Conference USA

After six weeks of Power Five action, we return to the Group of Five with Conference USA.

Here are the Conference USA standings.
So we know what each team achieved, but how did they perform? To answer that, here are the Yards Per Play (YPP), Yards Per Play Allowed (YPA) and Net Yards Per Play (Net) numbers for each Conference USA team. This includes conference play only, with the championship game not included. The teams are sorted by division by Net YPP with conference rank in parentheses.
College football teams play either eight or nine conference games. Consequently, their record in such a small sample may not be indicative of their quality of play. A few fortuitous bounces here or there can be the difference between another ho-hum campaign or a special season. Randomness and other factors outside of our perception play a role in determining the standings. It would be fantastic if college football teams played 100 or even 1000 games. Then we could have a better idea about which teams were really the best. Alas, players would miss too much class time, their bodies would be battered beyond recognition, and I would never leave the couch. As it is, we have to make do with the handful of games teams do play. In those games, we can learn a lot from a team’s YPP. Since 2005, I have collected YPP data for every conference. I use conference games only because teams play such divergent non-conference schedules and the teams within a conference tend to be of similar quality. By running a regression analysis between a team’s Net YPP (the difference between their Yards Per Play and Yards Per Play Allowed) and their conference winning percentage, we can see if Net YPP is a decent predictor of a team’s record. Spoiler alert. It is. For the statistically inclined, the correlation coefficient between a team’s Net YPP in conference play and their conference record is around .66. Since Net YPP is a solid predictor of a team’s conference record, we can use it to identify which teams had a significant disparity between their conference record as predicted by Net YPP and their actual conference record. I used a difference of .200 between predicted and actual winning percentage as the threshold for ‘significant’. Why .200? It is a little arbitrary, but .200 corresponds to a difference of 1.6 games over an eight game conference schedule and 1.8 games over a nine game one. Over or under-performing by more than a game and a half in a small sample seems significant to me. In the 2018 season, which teams in Conference USA met this threshold? Here are Conference USA teams sorted by performance over what would be expected from their Net YPP numbers.
Middle Tennessee State significantly exceeded their expected YPP record and qualified for the championship game for the first time since joining Conference USA. The Blue Raiders nearly won their first outright conference championship as an FBS program but lost to UAB thanks in part to having too many men on the field during a punt return. Middle Tennessee was a solid 2-1 in one-score conference games (prior to their close loss in the title game), but turnovers and non-offensive touchdowns were the reason they were able to exceed their expected record. The Blue Raiders had a league-best in-conference turnover margin of +10 and they also scored three non-offensive touchdowns while allowing none. UTEP and Florida Atlantic were the two Conference USA teams that failed to live up to their YPP numbers. UTEP had a league-worst in-conference turnover margin of -12, finished 1-2 in one-score conference games, and allowed four non-offensive touchdowns while scoring none of their own. For Florida Atlantic, the culprit was close game performance. Of their five conference losses, four came by a touchdown or less. Those four close losses came by a combined fifteen points, while each of their three conference wins came by at least nineteen points.

From the Penthouse to the Outhouse
Going in to the 2018 season, Florida Atlantic was a prohibitive favorite in the east division of Conference USA. And rightfully so. The Owls dominated the league in 2017, winning all eight of their regular season games, with seven coming by double digits, drubbing North Texas in the Conference USA Championship Game, and embarrassing Akron in their bowl game on the way to a school-record eleven victories. Thanks to the, shall we say, interesting career path of their head coach, they even got to hang on to him for another year. A lot of things can go wrong over the course of a football season, but worst case scenario for 2018 seemed to be a second consecutive bowl game. Yet, when December rolled around, the Owls were home for the holidays, having posted a 5-7 overall record (just 3-5 in Conference USA). While it probably wasn’t what their fans were expecting, Florida Atlantic did put together a historic season in 2018. They became just the tenth team since 1998 (the beginning of the BCS era) to finish with a losing conference record one season after going unbeaten in league play. The others are listed below.
Florida Atlantic is even more unique as they, along with BYU, were the lone mid-major (non-BCS or Group of Five) team to post a losing record despite retaining their head coach. The other mid-major teams on this list (Ball State, Central Michigan, Kent State, and Tulane) lost their head coaches to better jobs after their undefeated campaigns or in the case of TCU, moved to a power conference.

Can Florida Atlantic expect to rebound to their previous status in 2019? To find out, I looked at the follow-up conference records for those nine teams. They are summarized below.
Six of the nine teams saw their conference win total improve after their collapse, two declined, and one finished with the same conference record. On average, the teams improved by about six tenths of a conference win the next season. However, if we remove TCU from the equation, as the circumstances surrounding their decline involved an uptick in competition, the results are a little better.
Six of the eight teams saw their conference win total improve, one declined, and one stayed the same. On average the teams improved by nearly one win in conference play the next season. Were I a Florida Atlantic fan, I would feel pretty good heading into 2019. Based on the admittedly small sample here, FAU can expect to improve, albeit probably not to the dizzying heights they reached in 2017. Still, a small improvement in conference play would get them back to a bowl and have them in contention for the division.