Thursday, March 30, 2023

2022 Yards Per Play: MAC

Before we get started, happy Opening Day to all who celebrate. Five conferences down and we are now on the back nine of our season reviews. This week we head to the midwest to examine the Big 10's little brother, the MAC. 

Here are the 2022 MAC standings.
So we know what each team achieved, but how did they perform? To answer that, here are the Yards Per Play (YPP), Yards Per Play Allowed (YPA) and Net Yards Per Play (Net) numbers for each MAC team. This includes conference play only, with the championship game not included. The teams are sorted by division by Net YPP with conference rank in parentheses.
College football teams play either eight or nine conference games. Consequently, their record in such a small sample may not be indicative of their quality of play. A few fortuitous bounces here or there can be the difference between another ho-hum campaign or a special season. Randomness and other factors outside of our perception play a role in determining the standings. It would be fantastic if college football teams played 100 or even 1000 games. Then we could have a better idea about which teams were really the best. Alas, players would miss too much class time, their bodies would be battered beyond recognition, and I would never leave the couch. As it is, we have to make do with the handful of games teams do play. In those games, we can learn a lot from a team’s YPP. Since 2005, I have collected YPP data for every conference. I use conference games only because teams play such divergent non-conference schedules and the teams within a conference tend to be of similar quality. By running a regression analysis between a team’s Net YPP (the difference between their Yards Per Play and Yards Per Play Allowed) and their conference winning percentage, we can see if Net YPP is a decent predictor of a team’s record. Spoiler alert. It is. For the statistically inclined, the correlation coefficient between a team’s Net YPP in conference play and their conference record is around .66. Since Net YPP is a solid predictor of a team’s conference record, we can use it to identify which teams had a significant disparity between their conference record as predicted by Net YPP and their actual conference record. I used a difference of .200 between predicted and actual winning percentage as the threshold for ‘significant’. Why .200? It is a little arbitrary, but .200 corresponds to a difference of 1.6 games over an eight game conference schedule and 1.8 games over a nine game one. Over or under-performing by more than a game and a half in a small sample seems significant to me. In the 2022 season, which teams in the MAC met this threshold? Here are MAC teams sorted by performance over what would be expected from their Net YPP numbers.
Buffalo and Ohio significantly overachieved relative to their YPP numbers while Northern Illinois and Akron significantly underachieved. Neither Buffalo nor Ohio were remarkably fortunate in one-score conference games (Buffalo was 3-2 and Ohio was 1-1), but both dominated the turnover margin in MAC play. Ohio had the best in-conference turnover margin at +15 while Buffalo was a distant second at +8. Buffalo and Ohio also benefited greatly from fourth down variance. Buffalo converted two thirds of their fourth down attempts in MAC play (18 of 27) while allowing a conversion rate of just over 42% (8 of 19). Ohio did not attempt a lot of fourth down conversions (only nine attempts in MAC play which they converted four times), but their defense faced twenty three fourth down attempts and allowed just seven conversions (30%). Akron's underachievement was a combination of bad close game luck (0-5 in one-score MAC games) and a poor turnover margin (-12 in MAC play). Northern Illinois was not exceptionally unfortunate in close games (1-2 in one-score conference games), nor was their turnover margin extremely poor (-1 in MAC play). Their poor record was most likely the football gods evening things out after last season

Run Tell Dat
Do you know who the longest tenured coach in the MAC is? Its actually a tie between Chuck Martin at Miami and Chris Creighton at Eastern Michigan. In honor of their longevity and general anonymity in the larger college football ecosystem, we are going to clebrate those two gentlemen by analyzing their accomplishments over the next two weeks. We'll start with Chuck Martin. 

Chuck Martin won a pair of national titles at Grand Valley State before taking an assistant job under another former Grand Valley State head coach at Notre Dame. After four seasons on the Notre Dame staff, he took over the Miami program prior to the 2014 season. While Miami has a reputation for incubating great coaches, its fair to say the program was in relative shambles when he arrived. Miami finished 0-12 in 2013 and despite a shocking MAC title in 2010, the general trend was a downward one (8-32 MAC record in the other five seasons between 2008 and 2013). Martin did not employ quick fixes, finishing a combined 5-19 in his first two seasons (4-12 MAC record). However, since then, Miami has been one of the best teams in the MAC. 
Despite posting the third best conference record in that span, the Redhawks have only managed to win one division title. They have finished a game back on two occasions and lost out on a tiebreaker one other time. However, unlike their division brethren, Miami has managed to close the deal in the MAC Championship Game. 
Miami is also one of only two MAC teams to not post a losing conference record since 2016. 
The Redhawks have not dominated the MAC under Chuck Martin, but they have been one of the most consistent teams in the league. I expect another solid showing in 2023 and with a little bit of luck, they could be right back in the MAC Championship Game. 

Thursday, March 23, 2023

2022 Adjusted Pythagorean Record: Conference USA

Two weeks ago we looked at how Conference USA teams fared in terms of yards per play. his week, we turn our attention to how the season played out in terms of the Adjusted Pythagorean Record, or APR. For an in-depth look at APR, click hereIf you didn’t feel like clicking, here is the Reader’s Digest version. APR looks at how well a team scores and prevents touchdowns. Non-offensive touchdowns, field goals, extra points, and safeties are excluded. The ratio of offensive touchdowns to touchdowns allowed is converted into a winning percentage. Pretty simple actually.

Once again, here are the 2022 Conference USA standings.
And here are the APR standings with conference rank in offensive touchdowns, touchdowns allowed, and APR in parentheses. This includes conference games only with the championship game excluded.
Finally, Conference USA teams are sorted by the difference between their actual number of wins and their expected number of wins according to APR.
UTSA was the only Conference USA team that saw their APR differ significantly from their actual record. The Roadrunners also overachieved relative to their Yards Per Play numbers and we went over some reasons for that last week. 

Best Debuts
The Conference USA standings will look a bit different in 2023 and not just because of the usual year to year variance in team performance. Six teams are joining the AAC (Charlotte, Florida Atlantic, North Texas, Rice, UAB, and UTSA) and the league is adding a quartet of reinforcements (Jacksonville State, Liberty, New Mexico State, and Sam Houston State). This got me thinking about conference newcomers and how those teams have performed in their first year in the new league. Which teams have performed the best in their debut season? Read on to find out. 

I limited my analysis to non-BCS/Group of Five conferences since 1998 (what I consider the modern era of college football). We'll start with teams that finished with unblemished records in their first year.
After finishing with a 5-6 record in their final season in Conference USA in 2004, TCU jumped to the Mountain West and finished 8-0 in league play. The Horned Frogs won tight games against BYU, San Diego State, and Utah, but dominated their other five league opponents en route to a final ranking of eleventh in the AP Poll. Georgia Southern finished in a three-way tie atop the Southern Conference in 2012, but were a disappointing 4-4 in Southern Conference action in 2013, their final season of play as an FCS team. Head coach Jeff Monken took the Army job and Willie Fritz was hired to lead the team in their maiden voyage as an FBS program in the Sun Belt. The Eagles lost tight games to NC State and Georgia Tech in non-conference play, but with their funky triple option offense, they sliced through the Sun Belt. In their first six conference games, the Eagles averaged over 42 points per game. The offense hit a rut in November managing 50 total points in their final two league games, but the Eagles won both to finish with an unbeaten league record. 

While TCU and Georgia Southern were the only teams to finish with unbeaten league records, two other teams manged to finish with one loss and at least a share of a conference title in their new league. 
Louisiana Tech finished 3-9 as an Independent in 2000. They joined the WAC in 2001 and nothing was expected of them. The Bulldogs won their WAC opener against SMU, but lost to national darling and top ten ranked Fresno State. After the loss to the Bulldogs from Fresno, the Bulldogs from Ruston won their final six league games, including one against fellow WAC newcomer Boise State. Fresno State lost back to back games to Boise and Hawaii in midseason and Louisiana Tech ended up as the outright WAC champ. A little more than a decade later, Fresno State moved from the dying WAC to the Mountain West. The Bulldogs were a disappointing 4-9 in 2011, but they returned to their previous level of play in 2012 and finished in a three-way tied atop the Mountain West with Boise State and San Diego State. 

Finally, there are three other debuts I want to spotlight. One team finished 6-2, but won their conference. Another finished 7-1, but lost the division due to a head to head tiebreaker, and another won their division, but wasn't allowed to participate in their conference title game. 
Tulsa struggled through a 4-8 season in 2004, their last in the WAC. In their first season in Conference USA, the Golden Hurricane finished 6-2 in league play. Tulsa enjoyed a nice bounceback season, and thanks to UTEP dropping their final two games of the regular season, they won the West Division in the first year of divisional play in Conference USA. In the title game, they beat UCF on the road. Navy joined a conference for the first time in 2015. They opened AAC play 7-0, winning each of their first seven games by at least ten points. In the regular season finale, they traveled to Houston with the AAC West title on the line. The Cougars rolled up 52 points on their way to clinching the division and keeping the Midshipmen out of the conference title game. James Madison won their first five games as an FBS program in 2022 and were able to climb into the lower reaches of the AP Poll. They subsequently lost three games in a row, but only two of them were in Sun Belt play. Then in their regular season finale, they pounded the eventual Sun Belt East representative, Coastal Carolina, by forty points. The victory technically made the Dukes the East Division champion, but they were barred from playing in the championship game. 

Can Jacksonville State, Liberty, New Mexico State, or Sam Houston State run roughshod over Conference USA in 2023 and join the elite ranks of the teams mentioned in this space? Only time will tell. 

Monday, March 13, 2023

2023 Bracket Advice: Is Houston a Safe Bet?

Its that time once again where we take a brief respite from reviewing the previous college football season and try to give you free advice to win your March Madness pool. Before we get started, I'll refer you to my magnum opus on the subject from the tourney that didn't happen three years ago (in other words, don't pencil Purdue in for the Final Four). 

Heading into the 2023 NCAA Tournament, Houston has earned a number one seed. This marks the Cougars fifth consecutive tournament appearance with the team having earned a top six seed each time. Considering Houston appeared in one tourney between 1993 and 2017, this is an amazing accomplishment for the program and in particular head coach Kelvin Sampson. His hair may not be long, but Sampson has done some heavy lifting since becoming head coach prior to the 2015 season. This is the second ever top seed for Houston, with the other coming courtesy of the revered 1983 Phi Slama Jama squad. While Houston is slated to join the Big 12 next season, they concluded their run in the AAC in 2023. And that simple fact may bias some college basketball fans against the Cougars when filling out their brackets. Can you really trust a top seed from a 'lesser' conference? As much as you can trust any top seed in March, the answer may surprise you.

To get an idea of what we can expect from Houston in the 2023 NCAA tournament, we first need to look at other top seeds that did not come from power conferences. What do I mean by power conferences? That typically means the Power Five football leagues (ACC, Big 10, Big 12, Pac-12, and SEC) and the Big East. However, throughout college basketball history, you can argue other leagues, like Conference USA, were power conferences at some point. I went through each top seed since 1985. The NCAA began seeding teams in 1979, but 1985 coincides with the expansion of the tournament to 64 teams and other changes shortly thereafter (the adoption of the shot clock in 1986 and the addition of the three point shot to the tournament in 1987) make 1985, in my humble opinion, the beginning of the modern era of college basketball. By my accounting, there have been 14 previous top seeds since 1985 that came from outside the power conferences. They are listed below along with their conference and their tournament run. 
Those 14 teams had a pretty successful March in aggregate. One won the title, three more played for the title, seven made the Final Four, and all but two made it to the second weekend. However, we need context for the success (or lack thereof) for those 14 teams. How do number one seeds typically perform? To get a better idea of how those 14 teams performed, we need to compare them to the other 134 teams to have received one seeds since 1985. 

We'll start with a simple comparison. These are the aggregate tournament winning percentages of each group. 
The 14 mid-majors performed in line with the other one seeds. While those 14 teams finished with a slightly lower overall wining percentage, the difference is not significant. Now we'll dive into the data a little deeper. How do those 14 teams compare with other one seeds in terms of winning in the first and second round? 
Once again, the mid-majors are on par with the other one seeds. All 14 won their first round game and only two were knocked off in the second round. Gonzaga's 2013 loss was a bad look for mid-major apologists like myself, but Wichita State deserved better in 2014 than facing an under-seeded Kentucky team. For the power conference one seeds, Virginia is the lone top seed to ever lose in the first round and the other one seeds have been knocked off in the second round at about the same clip as the mid-major one seeds. Like the first comparison, this is a push. Now lets see see how the two groups of one seeds perform in third and fourth round games. 
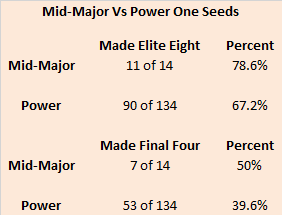
Here the 14 mid-majors outshine the power conference top seeds. Nearly 79% of the mid-major one seeds have advanced to the Elite Eight compared to 67% of the power conference one seeds. In addition, fully half of the mid-major one seeds advanced to the Final Four compared to 40% of the power conference one seeds. Finally, how do the mid-major one seeds compare once they get to the Final Four?
This is where the mid-majors fall short. They have advanced to the national championship game at better rates than the power conference one seeds, but they have not been able to close the deal like their power conference brethren. UNLV is the only squad to actually cut down the nets, representing just 7% of mid-major one seeds. Meanwhile, more than double that percentage (17%) of power conference one seeds have won the national title. However, the difference is not as profound as you might think. Since we are dealing with a sample size of 14 teams in the mid-major one seed category, an additional victory could have a dramatic impact on the percentages. What if Mario Chalmers did not make that heroic shot to tie the 2008 championship game with Memphis where Kansas eventually prevailed in overtime? If Memphis wins that game, the mid-majors have two titles which moves their percentage up to 14% and drops the power conference percentage down to 16%. Gonzaga is responsible for the other title game appearances by mid-major one seeds and while they were dominated in their most recent championship appearance, they led North Carolina at the half in 2017 and that game was in doubt until the final minute. 

So what can we conclude? Houston probably won't win the national title in 2023. But you can say that about the other 67 teams in the NCAA Tournament as well. The Cougars are as good a championship selection as any other number one seed, conference pedigree be damned.

Thursday, March 09, 2023

2022 Yards Per Play: Conference USA

After six consecutive weeks of Power Five leagues, this week we return to the Group of Five and examine Conference USA.

Here are the 2022 Conference USA standings.
So we know what each team achieved, but how did they perform? To answer that, here are the Yards Per Play (YPP), Yards Per Play Allowed (YPA) and Net Yards Per Play (Net) numbers for each Conference USA team. This includes conference play only, with the championship game not included. The teams are sorted by Net YPP with conference rank in parentheses.
College football teams play either eight or nine conference games. Consequently, their record in such a small sample may not be indicative of their quality of play. A few fortuitous bounces here or there can be the difference between another ho-hum campaign or a special season. Randomness and other factors outside of our perception play a role in determining the standings. It would be fantastic if college football teams played 100 or even 1000 games. Then we could have a better idea about which teams were really the best. Alas, players would miss too much class time, their bodies would be battered beyond recognition, and I would never leave the couch. As it is, we have to make do with the handful of games teams do play. In those games, we can learn a lot from a team’s YPP. Since 2005, I have collected YPP data for every conference. I use conference games only because teams play such divergent non-conference schedules and the teams within a conference tend to be of similar quality. By running a regression analysis between a team’s Net YPP (the difference between their Yards Per Play and Yards Per Play Allowed) and their conference winning percentage, we can see if Net YPP is a decent predictor of a team’s record. Spoiler alert. It is. For the statistically inclined, the correlation coefficient between a team’s Net YPP in conference play and their conference record is around .66. Since Net YPP is a solid predictor of a team’s conference record, we can use it to identify which teams had a significant disparity between their conference record as predicted by Net YPP and their actual conference record. I used a difference of .200 between predicted and actual winning percentage as the threshold for ‘significant’. Why .200? It is a little arbitrary, but .200 corresponds to a difference of 1.6 games over an eight game conference schedule and 1.8 games over a nine game one. Over or under-performing by more than a game and a half in a small sample seems significant to me. In the 2022 season, which teams in Conference USA met this threshold? Here are Conference USA teams sorted by performance over what would be expected from their Net YPP numbers.
UTSA significantly overachieved relative to their YPP numbers while UAB underachieved (more on them in a second). UTSA finished their penance in Conference USA by running the table and winning their second consecutive league title. However, the Roadrunners were fortunate to finish with an unblemished record, posting a 4-0 mark in one-score conference games. One of those close victories came against UAB. The Blazers finished 0-4 in one-score conference games, but won their other four league games by a combined 71 points. 

The Best .500 Team
By falling short of their expected record so dramatically, UAB became the best mid-major team ever to finish with precisely a .500 record (at least as measured by Net YPP). UAB's Net YPP of +1.64 significantly outpaced Cincinnati (coached by contemporary asshole and future US Senator Tommy Tuberville) as the best ever at the Group of Five level (since 2005).
The Blazers were not able to top a handful of Power Five teams that also finished with .500 records. 
Arizona State has a giant asterisk as they only played four games in the pandemic shortened 2020 season. Of the teams that played a full conference schedule, UAB finished slightly behind a pair of teams coached by Mike Leach (in back to back seasons no less) and a recent Louisville squad.

Here at Statistically Speaking, we like to provide history lessons, but we also like to learn from history. How did the 'great' .500 teams perform the following season? Its a bit of a mixed bag. We'll start with the Group of Five.
Cincinnati hit rock bottom in Tommy Tuberville's final season and FAU, which closed 2013 by winning their final four games under an interim coach, hired the wrong guy and suffered through a rough three season stretch under the Partridge Family. However, there were a few success stories as well. Houston won Conference USA in 2006 under fourth year head coach and guy has nothing to hide, Art Briles. Hawaii and Utah State nearly won their respective conferences, but lost close games to Boise State that ultimately cost them a shot at the WAC and Mountain West title. Nevada revved up their Pistol attack and improved slightly behind quarterback Colin Kaepernick and Hall of Fame coach Chris Ault

At the Power Five level, the follow up results were also quite mixed. 
Arkansas fired Houston Nutt and struggled in their first season under Bobby Petrino. Louisville, Miami, and Texas Tech maintained their .500 records the following season. After actually winning the Big 10 despite a .500 record in 2012, Wisconsin improved the following season under first year head coach Gary Andersen, but were no match for Michigan State and Ohio State who both rolled through the league with unbeaten conference records. After back to back .500 seasons, Texas Tech exploded under Mike Leach and finished in an infamous three-way tie with Oklahoma and Texas for the Big 12 South crown. Finally, Tennessee finished with their best season perhaps in this century just this past year. And for what its worth, Arizona State also improved, but I didn't include them due to the limited schedule they played in 2020. 

Projecting UAB's 2023 season is a real Rorschach Test. UAB played well in 2022, but could not seal the deal in close games. Their head coach retired due to health issues over the summer and they played all season under an inexperienced interim. Of course they are bound for greatness with a full offseason under a new regime and some better close game good fortune! But, they made a weird coaching hire. Not that it can't be successful. It was just odd. The Blazers are also stepping up in weight class as they join the AAC for the 2023 campaign. If UAB were a stock and I were a TV personality who pretended to know what stocks to pick, I'd give the Blazers a 'HOLD' rating. 

Thursday, March 02, 2023

2022 Adjusted Pythagorean Record: Big 12

Last week we looked at how Big 12 teams fared in terms of yards per play. his week, we turn our attention to how the season played out in terms of the Adjusted Pythagorean Record, or APR. For an in-depth look at APR, click hereIf you didn’t feel like clicking, here is the Reader’s Digest version. APR looks at how well a team scores and prevents touchdowns. Non-offensive touchdowns, field goals, extra points, and safeties are excluded. The ratio of offensive touchdowns to touchdowns allowed is converted into a winning percentage. Pretty simple actually.

Once again, here are the 2022 Big 12 standings.
And here are the APR standings with conference rank in offensive touchdowns, touchdowns allowed, and APR in parentheses. This includes conference games only with the championship game excluded.
Finally, Big 12 teams are sorted by the difference between their actual number of wins and their expected number of wins according to APR.
TCU and Oklahoma State significantly exceeded their APR while Iowa State significantly underachieved. TCU and Iowa State also over and underachieved respectively based on their YPP numbers and we went over some reasons for that last week. Oklahoma State actually played well for the first half of conference play. Through four games, the Cowboys were 3-1 in the league with their lone loss coming in overtime to TCU. However, they staggered home like a criminally over-served tavern patron, losing four of their last five with three of losses coming by at least two touchdowns and their lone victory coming by six points. 

Going Streaking
Brent Venables, regarded as one of the best defensive coordinators in college football, was expected to continue the lineage of elite teams at Oklahoma. The Sooners were the preseason favorite in the Big 12 and were ranked ninth in the preseason AP Poll. Oklahoma opened the season winning their three non-conference games by a combined 97 points culminating with a beatdown of former Big 8 rival Nebraska. Another Big 12 title and a potential CFP bid seemed on the horizon. Then the Sooners dropped their conference opener to Kansas State, lost their starting quarterback to injury against TCU, and without him suffered their worst defeat in Red River history. The Sooners stemmed the tide somewhat midseason, beating both Kansas and Iowa State, but lost three of four down the stretch to finish the regular season 6-6. But more importantly, at least for our purposes, they finished with a losing conference record for the first time since 1998. 

John Blake, a former Oklahoma defensive lineman under Barry Switzer, coached the Sooners for three seasons (1996-1998), neatly coinciding with the beginning of the Big 12. His tenure exacerbated the malaise that began under Gary Gibbs in the late 80's and continued with the forgettable single season of Howard Schnellenberger. The Sooners finished with losing records in each of Blake's three seasons and never finished better than 3-5 in Big 12 play. Venables arrived as an assistant on Bob Stoop's first staff in 1999 and the Sooners did not finish with a losing conference record until Venables returned as head coach in 2022. 

1998 serves as good inflection point in the history of college football. It was not the beginning of the modern era, but it did represent a more regimented segregation between the haves (BCS and later Power Five conferences) and the have-nots (non-BCS and Group of Five conferences). It was also the (theoretical) end of split national titles. So in the spirit of that inflection point, and in honor of Oklahoma's long run, which power conference teams in the BCS and CFP eras have endured the fewest losing conference records? Read on to find out. 
Like Oklahoma, Clemson also finished with a losing conference record in 1998 and fired the responsible party. Despite a losing overall record in 2011, they have not finished with a losing conference record since. Joining Clemson at the top and edging out Ohio State and Oklahoma is Georgia which finished 3-5 in SEC play in 2010, but has not had a losing league record in any other season of the BCS/CFP era. Cincinnati has an asterisk as they were only in a BCS conference for nine seasons (2005-2013). 

What about the other side of the coin? Which power conference teams have posted the most losing conference records? I bet you could guess most of them.
2007 and 2008. Those were the only seasons in the BCS/CFP era when Kansas did not finish with a losing conference record. The other teams that populate this list are a who's who of basement dwellers for the past quarter century. However, I must admit, I am a little shocked at Arizona's place on this list. Even Rich Rodriguez could only manage two winning Pac-12 records over his six seasons in Tucson.

Before we close, lets look at the most consecutive seasons without a losing conference record.
Clemson's streak is still active and baring an unforeseen set of circumstances, the Tigers should see their streak reach a quarter century in 2023.

And finally, the most consecutive seasons with a losing conference record.
Kansas is just a few years away from matching Indiana's streak of futility. Can the Jayhawks end the skid in 2023? Stay tuned to find out.