Thursday, February 23, 2023

2022 Yards Per Play: Big 12

This week we head to another Big conference that managed to produce both a surprise champion and a surprise playoff participant

Here are the 2022 Big 12 standings. 
So we know what each team achieved, but how did they perform? To answer that, here are the Yards Per Play (YPP), Yards Per Play Allowed (YPA) and Net Yards Per Play (Net) numbers for each Big 12 team. This includes conference play only, with the championship game not included. The teams are sorted by Net YPP with conference rank in parentheses.
College football teams play either eight or nine conference games. Consequently, their record in such a small sample may not be indicative of their quality of play. A few fortuitous bounces here or there can be the difference between another ho-hum campaign or a special season. Randomness and other factors outside of our perception play a role in determining the standings. It would be fantastic if college football teams played 100 or even 1000 games. Then we could have a better idea about which teams were really the best. Alas, players would miss too much class time, their bodies would be battered beyond recognition, and I would never leave the couch. As it is, we have to make do with the handful of games teams do play. In those games, we can learn a lot from a team’s YPP. Since 2005, I have collected YPP data for every conference. I use conference games only because teams play such divergent non-conference schedules and the teams within a conference tend to be of similar quality. By running a regression analysis between a team’s Net YPP (the difference between their Yards Per Play and Yards Per Play Allowed) and their conference winning percentage, we can see if Net YPP is a decent predictor of a team’s record. Spoiler alert. It is. For the statistically inclined, the correlation coefficient between a team’s Net YPP in conference play and their conference record is around .66. Since Net YPP is a solid predictor of a team’s conference record, we can use it to identify which teams had a significant disparity between their conference record as predicted by Net YPP and their actual conference record. I used a difference of .200 between predicted and actual winning percentage as the threshold for ‘significant’. Why .200? It is a little arbitrary, but .200 corresponds to a difference of 1.6 games over an eight game conference schedule and 1.8 games over a nine game one. Over or under-performing by more than a game and a half in a small sample seems significant to me. In the 2022 season, which teams in the Big 12 met this threshold? Here are Big 12 teams sorted by performance over what would be expected from their Net YPP numbers.
TCU and Texas Tech significantly exceeded their expected record based on YPP while Kansas and Iowa State underachieved. TCU and Texas Tech combined to finish 7-0 in one-score Big 12 games, buoying their respective league records. TCU also had the best in-conference turnover margin in Big 12 play (+7) and while Texas Tech was insanely aggressive under first year head coach Joey McGuire (lead nation in fourth down attempts), they managed to convert an unsustainable percentage of their fourth downs (64%). Iowa State finished 0-6 in one-score Big 12 games and also had the worst in-conference turnover margin (-10). Kansas was not unfortunate in close Big 12 games (1-1 record), but their defense could not get off the field in high-leverage situations, allowing Big 12 opponents to covert nearly 73% of their fourth down attempts. 

Closing the Deal
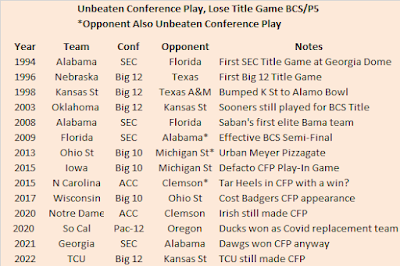
TCU became the first Big 12 team other than Oklahoma to make the College Football Playoff in 2022. They became the first Big 12 team to play for a national championship since Texas in 2009. And they were also the first ever Big 12 team to win a College Football Playoff Game. Tremendous accolades all. However, I derive pleasure from pointing out failure. And did you know that TCU did not even win the Big 12 in 2022? In fact, they joined a longer than expected list of BCS/Power Five teams to finish unbeaten in conference play and lose their conference title game. 
2022 marked the third consecutive year this phenomenon occurred. Despite the setbacks, the three legitimate contenders were still selected by the CFP Committee (Southern Cal was 13th in the penultimate CFP rankings in 2020 and were unlikely to qualify had they beaten Oregon in the Pac-12 Championship Game). 

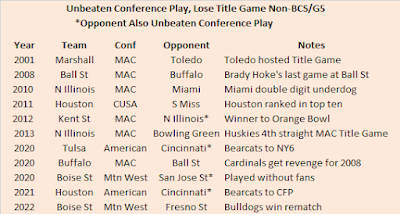
The list of non-BCS/Group of Five teams to lose their conference title game after rolling through league play with an unblemished record is not much shorter. 
This trend has also happened at the Group of Five level each of the past three seasons, including thrice in the Covid year of 2020. 

We had a little fun at TCU's expense in this post, but I want to congratulate the Horned Frogs on a great season. For my money, the 2014 team was better and just as deserving of a CFP bid. Plus, I would have loved to have seen what the 2009 or 2010 teams could have done in a system that did not exclude non-BCS conference schools. 

Thursday, February 16, 2023

2022 Adjusted Pythagorean Record: Big 10

Last week we looked at how Big 10 teams fared in terms of yards per play. his week, we turn our attention to how the season played out in terms of the Adjusted Pythagorean Record, or APR. For an in-depth look at APR, click hereIf you didn’t feel like clicking, here is the Reader’s Digest version. APR looks at how well a team scores and prevents touchdowns. Non-offensive touchdowns, field goals, extra points, and safeties are excluded. The ratio of offensive touchdowns to touchdowns allowed is converted into a winning percentage. Pretty simple actually.

Once again, here are the 2022 Big 10 standings.
And here are the APR standings with conference rank in offensive touchdowns, touchdowns allowed, and APR in parentheses. This includes conference games only with the championship game excluded.
Finally, Big 10 teams are sorted by the difference between their actual number of wins and their expected number of wins according to APR.
Purdue significantly exceeded their APR while their division mates Illinois and Minnesota underachieved. Purdue also overachieved relative to their YPP numbers and we went over some reasons for that last week. Illinois was probably the best team in the Big 10 West, but they finished 1-4 in one-score conference games. If Illinois was not the best team in the Big 10 West, Minnesota may have been. The Gophers actually had a winning record in one-score conference games (2-1), but they were absurdly dominant in their other three league wins (won by a combined 86 points) which boosted their APR. 

Purdue's Historical Season
Purdue became the ninth Big 10 team to play in the conference's title game in 2022 (Illinois, Indiana, Maryland, Minnesota, and Rutgers are the five still waiting for their first appearance) and in the process became just the fourth BCS/Power Five conference title game participant to allow more touchdowns than they scored in league play. 
Purdue was unable to join Virginia Tech and actually capture their conference's crown despite allowing more touchdowns than they scored. 

We try not to give short shrift to the Group of Five around these parts, so I would be remiss if I left out the non-BCS/Group of Five teams that qualified for their conference's championship game despite allowing more touchdowns than they scored. 
It's a small sample, but the Group of Five teams that allowed more touchdowns than they scored actually won two of three league title games. 

How did the other six teams that accomplished this feat before Purdue perform the next season? It's a mixed bag, but a few of the teams enjoyed continue success.
East Carolina and Bowling Green actually won Conference USA and the MAC the following season while UCLA once again qualified for the Pac-12 Championship Game. Northern Illinois and Tennessee fell on hard times, but Purdue fans can take solace their team is not doomed to tumble in the Big 10 standings next season. 

Thursday, February 09, 2023

2022 Yards Per Play: Big 10

Two conferences down, eight to go. We head to the midwest this week and examine the Big 10, home of two playoff participants (and zero playoff wins) in 2022. 

Here are the 2022 Big 10 standings. 
So we know what each team achieved, but how did they perform? To answer that, here are the Yards Per Play (YPP), Yards Per Play Allowed (YPA) and Net Yards Per Play (Net) numbers for each Big 10 team. This includes conference play only, with the championship game not included. The teams are sorted by division by Net YPP with conference rank in parentheses.
College football teams play either eight or nine conference games. Consequently, their record in such a small sample may not be indicative of their quality of play. A few fortuitous bounces here or there can be the difference between another ho-hum campaign or a special season. Randomness and other factors outside of our perception play a role in determining the standings. It would be fantastic if college football teams played 100 or even 1000 games. Then we could have a better idea about which teams were really the best. Alas, players would miss too much class time, their bodies would be battered beyond recognition, and I would never leave the couch. As it is, we have to make do with the handful of games teams do play. In those games, we can learn a lot from a team’s YPP. Since 2005, I have collected YPP data for every conference. I use conference games only because teams play such divergent non-conference schedules and the teams within a conference tend to be of similar quality. By running a regression analysis between a team’s Net YPP (the difference between their Yards Per Play and Yards Per Play Allowed) and their conference winning percentage, we can see if Net YPP is a decent predictor of a team’s record. Spoiler alert. It is. For the statistically inclined, the correlation coefficient between a team’s Net YPP in conference play and their conference record is around .66. Since Net YPP is a solid predictor of a team’s conference record, we can use it to identify which teams had a significant disparity between their conference record as predicted by Net YPP and their actual conference record. I used a difference of .200 between predicted and actual winning percentage as the threshold for ‘significant’. Why .200? It is a little arbitrary, but .200 corresponds to a difference of 1.6 games over an eight game conference schedule and 1.8 games over a nine game one. Over or under-performing by more than a game and a half in a small sample seems significant to me. In the 2022 season, which teams in the Big 10 met this threshold? Here are Big 10 teams sorted by performance over what would be expected from their Net YPP numbers.
Purdue and Michigan were the only Big 10 teams that saw their expected record differ significantly from their actual record. Both the Boilermakers and Wolverines overachieved and whaddaya know, they also happened to play in the Big 10 Championship Game. Michigan was a somewhat fortunate 2-0 on one-score Big 10 games while Purdue was 4-1 in such contests. 

Picture It, Ireland, 2022
Nebraska and Northwestern played one of the first college football games of the 2022 season in Ireland. The Cornhuskers and Wildcats were looking to rebound from disappointing 2021 campaigns. Both schools finished at the bottom of the Big 10 West with identical 1-8 conference records. Northwestern was legitimately bad, but Nebraska was better than their record by almost any statistical measure. The opener was big for both teams. For Northwestern, it was an opportunity for the Wildcats to prove the Covid-delayed 2020 season was not a fluke. The Wildcats finished 6-1 in Big 10 play that season, qualified for the Big 10 Championship Game, and finished tenth in the final AP Poll (their first top ten finish since the historic 1995 season). However, sandwiched around that division title were identical 1-8 Big 10 records in 2019 and 2021. For Nebraska, 2022 was Scott Frost's last chance to succeed at his alma mater. Frost was hired after leading UCF to an undefeated record and dubious national title claim in 2017. However, in his first four seasons in Lincoln, the Cornhuskers lost nearly twice as many games (29) as they won (15). Frost made some staff changes heading into 2022, most notably tabbing Mark Whipple to be his offensive coordinator. The Cornhuskers also bid adieu to enigmatic quarterback Adrian Martinez and replaced him with Texas transfer Casey Thompson. There was a little preseason buzz for Nebraska and the Cornhuskers entered the game against the Wildcats as a double digit favorite. Nebraska built a double digit lead in the third quarter, but faltered in yet another close game, losing 31-28. And Frost, much like Fleishman, was in trouble. But I didn't come here to write any additional epitaphs on Scott Frost's tenure at Nebraska. I want to talk about the team that won the game in Ireland.

After Northwestern upset Nebraska, most Wildcat fans probably thought they were in store for a nice rebound season. After a bye, Northwestern's next three games were all at home against Duke (under a first year coach with low expectations), Southern Illinois (FCS), and Miami of Ohio. A road trip to Penn State immediately followed that homestand and Ohio State was on the schedule in November, but theoretically, Northwestern should have banked enough wins to be in contention for a bowl bid at the end of the season. That was not the case. Northwestern dropped all three of those winnable home games and then proceeded to lose all eight of their remaining conference games. In doing so, they joined a somewhat exclusive club, becoming just the fifteenth BCS/Power Five conference team since 2005 to win their conference opener and lose the rest of their conference games. 
The club gets even more exclusive when considering the fact that Northwestern pulled an upset in their conference opener. Only eight other teams pulled an upset in their conference opener and lost out in league play. 
Like the other eight teams on this list, Northwestern did not fool the betting market. The Wildcats were double digit underdogs in their final eight conference games. 

Thursday, February 02, 2023

2022 Adjusted Pythagorean Record: ACC

Happy Candlemas to all who celebrate!

Last week we looked at how ACC teams fared in terms of yards per play. his week, we turn our attention to how the season played out in terms of the Adjusted Pythagorean Record, or APR. For an in-depth look at APR, click hereIf you didn’t feel like clicking, here is the Reader’s Digest version. APR looks at how well a team scores and prevents touchdowns. Non-offensive touchdowns, field goals, extra points, and safeties are excluded. The ratio of offensive touchdowns to touchdowns allowed is converted into a winning percentage. Pretty simple actually.

Once again, here are the 2022 ACC standings. 
And here are the APR standings with conference rank in offensive touchdowns, touchdowns allowed, and APR in parentheses. This includes conference games only with the championship game excluded. Also, note Virginia and Virginia Tech's rankings are on a per game basis since they only played seven conference games due to a real world tragedy
Finally, ACC teams are sorted by the difference between their actual number of wins and their expected number of wins according to APR.
Georgia Tech (more on them later), Miami, and NC State significantly exceeded their expected APR while Wake Forest, Florida State, and Virginia underachieved. Georgia Tech, Miami, and NC State combined to finish 9-3 in one-score conference games. In addition, those three teams suffered ten double digit conference losses. If they weren't winning close, they were usually getting blown out. Meanwhile, Wake Forest, Florida State, and Virginia were a combined 2-8 in one-score conference games. Virginia was not able to get margin in any of their conference victories, but Wake Forest and Florida State combined to win seven ACC games by ten points or more. The Demon Deacons also finished with the worst in-conference turnover margin (-10) in the ACC which torpedoed their goal of repeating as division champs

Did Georgia Tech Improve?
The Geoff Collins era mercifully came to an end in late September after an ugly loss to UCF dropped the Yellow Jackets to 1-3. Under interim coach Brent Key, the team rallied, winning four of their final eight games to finish 5-7, their best record since Paul Johnson retired. Key's performance earned him the full time gig, and he appears to have the Yellow Jackets trending in the right direction. To illustrate this point, let's look at Georgia Tech's conference record under both men.
Under Key, Georgia Tech finished with a winning conference record, while they barely won more than a fourth of their games under Collins. At a minimum, Key should have the Yellow Jackets back in bowl contention over the next few seasons. But, just to be thorough, let's look under the hood. Here is how the Yellow Jackets fared in terms of Yards Per Play in ACC play under both men.
This has to be a misprint. The Yellow Jackets somehow put up a worse YPP Net under Key? Indeed they did. Their defensive improvement was more than offset by an offensive decline. What about my other favorite metric, APR? 
The Yellow Jackets scored and allowed touchdowns in ACC play at about the same ratio under Brent Key as they did under Geoff Collins. Under Collins, the Yellow Jackets won about one fewer conference game than we would expect based on the ratio of their touchdowns scored and allowed. Over 26 games they won seven league games instead of eight. Meanwhile, despite allowing more touchdowns than they scored under Key, the Yellow Jackets won four of the seven conference games he coached. 

How did Georgia Tech pull this off? While the Yellow Jackets did not fare any better under Key than they did under Collins in per play efficiency or scoring and allowing touchdowns, they were markedly improved in the oft ignored area of football: special teams.
The kicking game was a mess under Collins. In three plus seasons, Georgia Tech kickers made less than half their field goals. For comparisons sake, the median team field goal percentage in college football is about 75%. Key turned the kicking responsibilities over to Gavin Stewart after being named interim coach and he converted twelve of his thirteen kicks. Key also apparently allowed his special teams to practice kick and punt protection as the team did not allow any blocked kicks under his watch after allowing 16 under Collins, including four in their first four games of 2022. Did the team even practice special teams under Collins? Probably. That would seem like a pretty big oversight if they didn't, but based on their play, I can't definitively say they did. 

Another area where Georgia Tech improved under Key was turnover margin. 
In 26 ACC games under Collins, the Yellow Jackets finished in the red in the turnover department 14 times. They were 2-12 in those games. In games where they did not lose the turnover margin, Georgia Tech was a respectable 5-7. Under Key, the Yellow Jackets lost the turnover battle once. In the six games where they were even or in the black, they finished 4-2. 

So what do we make of the Brent Key hire? Key's promotion certainly saved the 2022 season (as much as a 5-7 record can qualify as 'saving'). Had the team not fired Collins, its quite possible Georgia Tech would have finished 0-8 or 1-7 in the ACC. The team played hard under Key and although they did not play better on a per play basis, the special teams improved dramatically and the turnover margin reversed course. We should probably give Key credit for identifying the best kicker on the team and for shoring up punt and field goal protection, but turnovers are notoriously fickle. It is highly unlikely that Georgia Tech averages a +1 margin in each conference game going forward under Key. I would like to have seen a bigger swing when it came time to name the full time head coach. I want to stress I am not a journalist or Georgia Tech insider, so I don't know who was a realistic candidate when the school was searching for a head coach. Key is an alum who obviously wanted the job, but an unsustainable turnover margin and a 4-1 record in one-score games made Georgia Tech look better than they were. I wish Key the best, but I think the Yellow Jackets will be in the market for a new head coach by the time the 2025 season kicks off (if not before).