Time to check in on our fourth conference of the offseason, the Big 12. Prior to the 2021 season, there was some
big news off the field, with Oklahoma and Texas opting to join the SEC sometime in the near future. While the Sooners and Longhorns are the flagship programs in the Big 12, the league showed its depth in 2021 as the Big 12 Championship Game was devoid of Sooner or Longhorn representation for the first time since 1998 and just the third time in the
game's history!
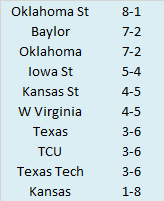
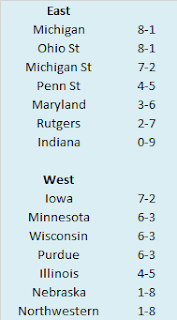
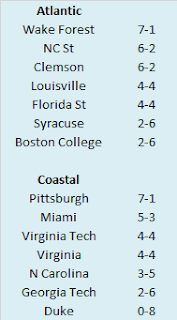
Here are the 2021 Big 12 standings.
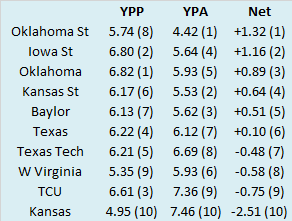
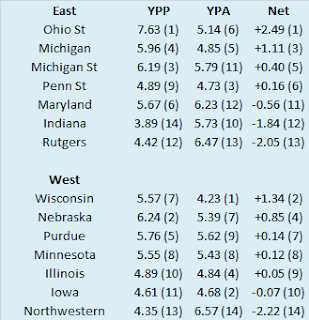
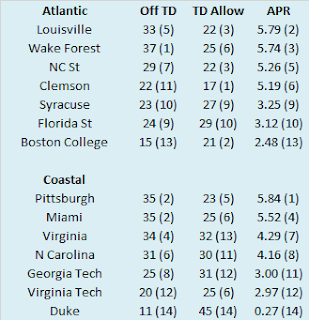
So we know what each team achieved, but how did they perform? To answer that, here are the Yards Per Play (YPP), Yards Per Play Allowed (YPA) and Net Yards Per Play (Net) numbers for each Big 12 team. This includes conference play only, with the championship game not included. The teams are sorted by Net YPP with conference rank in parentheses.
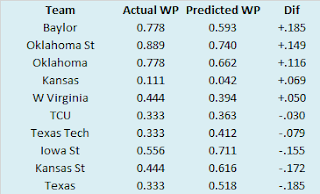
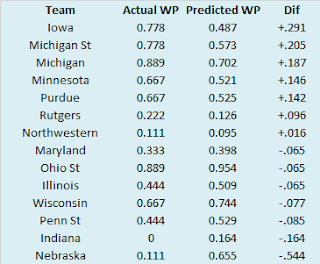
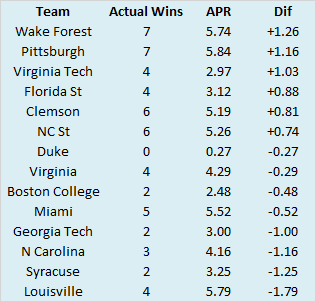
College football teams play either eight or nine conference games. Consequently, their record in such a small sample may not be indicative of their quality of play. A few fortuitous bounces here or there can be the difference between another ho-hum campaign or a special season. Randomness and other factors outside of our perception play a role in determining the standings. It would be fantastic if college football teams played 100 or even 1000 games. Then we could have a better idea about which teams were really the best. Alas, players would miss too much class time, their bodies would be battered beyond recognition, and I would never leave the couch. As it is, we have to make do with the handful of games teams do play. In those games, we can learn a lot from a team’s YPP. Since 2005, I have collected YPP data for every conference. I use conference games only because teams play such divergent non-conference schedules and the teams within a conference tend to be of similar quality. By running a regression analysis between a team’s Net YPP (the difference between their Yards Per Play and Yards Per Play Allowed) and their conference winning percentage, we can see if Net YPP is a decent predictor of a team’s record. Spoiler alert. It is. For the statistically inclined, the correlation coefficient between a team’s Net YPP in conference play and their conference record is around .66. Since Net YPP is a solid predictor of a team’s conference record, we can use it to identify which teams had a significant disparity between their conference record as predicted by Net YPP and their actual conference record. I used a difference of .200 between predicted and actual winning percentage as the threshold for ‘significant’. Why .200? It is a little arbitrary, but .200 corresponds to a difference of 1.6 games over an eight game conference schedule and 1.8 games over a nine game one. Over or under-performing by more than a game and a half in a small sample seems significant to me. In the 2021 season, which teams in the Big 12 met this threshold? Here are Big 12 teams sorted by performance over what would be expected from their Net YPP numbers. Based on the .200 standard, no teams in the Big 12 significantly over or underachieved relative to their yards per play numbers. Baylor and Texas came close, but both didn't quite make the cut.
The TCU Defense Hits Rock Bottom
Gary Patterson had a great run at TCU. During his two decades in charge, he built a mid-major power in Fort Worth and thanks to great timing, the Horned Frogs got called up to the majors when the Big 12 needed to replace some departing members. After being left for dead in the WAC when the Southwest Conference died in the mid-90's, the Horned Frogs have been in a major conference for a decade and they owe most of that to Patterson. However, for whatever reason, be it the empowerment of players, lack of scheme innovation, simply being in one place for two long, or something else, the 2021 TCU defense was the worst unit Patterson ever coordinated. The Horned Frogs allowed nearly 35 points per game (nearly 38 per game against FBS competition) and allowed more than seven yards per play to Big 12 opponents. You'll notice thanks to Kansas, they did not finish with the worst per play defense in the Big 12, but this was a unit that continuously blew assignments and gave up big plays. Is there hope for improvement in Fort Worth and Lawrence after both defenses posted such ghastly numbers in 2021? Read on to find out.
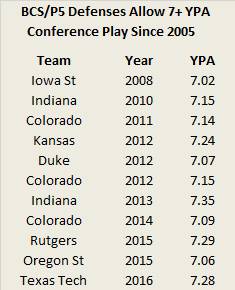
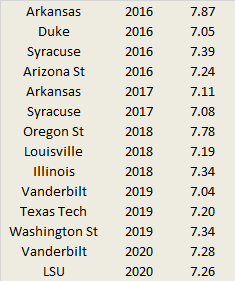
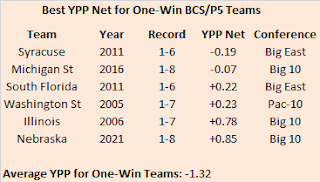
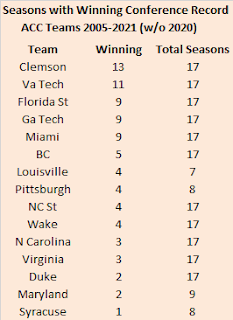
Kansas and TCU (and Duke) joined a once rare, but growing subset of college football teams: those that allowed at least seven yards per play to conference opponents. Between 2005 and 2020, 25 BCS/Power 5 teams accomplished this ignominious feat.
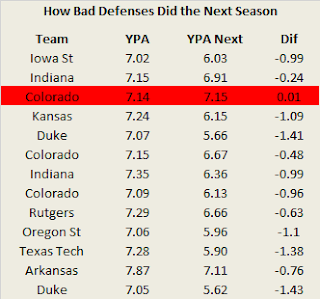
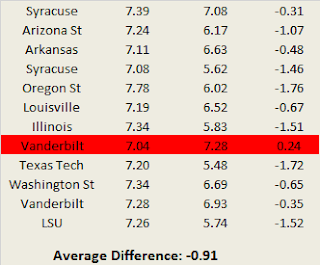
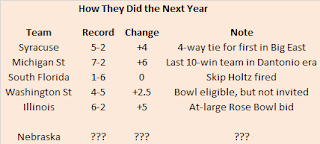
As you can see, with college football trending toward offense in scheme and rule enforcement, teams allowing more than seven yards per play is becoming more common. Between 2005 and 2011, a total of three BCS/Power 5 teams allowed more than seven yards per play to their conference opponents. Between 2012 and 2020, twenty-two did (along with three more in 2021). How did those previously porous defenses perform the next season? As with most extreme results, regression came a calling. 23 of the 25 teams improved their per play defense against conference foes the next season. Only Colorado in 2011 and Vanderbilt in 2019 saw their defenses play even worse the following season. On average, the 25 teams improved by nine tenths of a yard. While that may sound like a lot, remember, since they were allowing over seven yards per play, that meant on average their defenses were still bad, just not historically bad. TCU has a better track record than Kansas, especially on defense, so while both should improve defensively in 2022, I would expect TCU's to be more pronounced. I don't expect a return to their 2009 or 2010 form, but fielding a mediocre Big 12 defense is certainly within reason.
Thanks for reading. Next week, we'll take a look at the Adjusted Pythagorean Record in the Big 12. And while this post pointed out a reason to be optimistic about TCU heading into 2022, next week's post will outline some a reason for pessimism. That's what we in the business call a tease.