The 2022 season is over. As always, the college football season feels like it will never arrive, and then when it does, it ends in a flash. To help you navigate the dark and depressing offseason, we'll be reviewing the 2022 season for each FBS conference through the lens of Yards Per Play and the
Adjusted Pythagorean Record. We go alphabetically, so Sun Belt fans, check back around Memorial Day.
Here are the 2022 AAC standings.
So we know what each team achieved, but how did they perform? To answer that, here are the Yards Per Play (YPP), Yards Per Play Allowed (YPA) and Net Yards Per Play (Net) numbers for each AAC team. This includes conference play only, with the championship game not included. The teams are sorted by Net YPP with conference rank in parentheses.

Navy and Tulane exceeded their expected record while Memphis, Temple, and South Florida underachieved relative to their per play performance. For Navy, being an overachiever is par for the course (more on that in a bit). The Midshipmen and Green Wave combined to go 5-2 in one-score conference games, buoying their record. Tulane also had the best in-conference turnover margin at +9. Meanwhile, Memphis, Temple, and South Florida combined to finish an amazing 0-10 in one-score conference games. Memphis finished a perfect 0-4 in such games while Temple and South Florida were each 0-3.
Protect the Motherland
After the annual Army/Navy game, the United States Naval Academy rather unceremoniously fired longtime head coach Ken Niumatalolo. The firing may have been deserved. Navy has finished with a losing record in four of the past five seasons, but the timing and location were not a good look. But I'm not here to give Chet Gladchuk advice on handling his HR duties. Although, if he is a reader of this blog I do hereby offer my consulting services. No, I'm here to point out how great Ken Niumatalolo was at getting the most out of his Navy teams. Navy exceeded their expected record based on YPP the most of any AAC team in 2022. As I mentioned earlier, that was not unusual for the Midshipmen. Navy has been an AAC member since 2015 and in those eight seasons, they have consistently exceeded the meager expectations set by their YPP numbers. In those eight seasons, Navy has exceeded their expected record based on YPP by .179 points of winning percentage on average. A few paragraphs up, you'll note that I consider any one season deviation of .200 or greater significant. Over eight seasons under the same head coach, Navy nearly averaged a significant over-performance. In the long run, we would expect most teams to finish close to zero in terms of difference from their expected record. Outlier seasons in one direction tend to be evened out by more neutral seasons or outliers in the other direction. However, it appears Niumatalolo possessed some kind of secret sauce to get his teams to overachieve (it was probably the triple option). For comparison's sake, four other teams managed a positive differential between their actual record and their expected record based on YPP. If we combine those four teams average differential (.142), it would still be less than Navy's.
Before we move on, a few things regarding the table. Connecticut has an asterisk because they left the AAC after the 2019 season. And the last column in the table is simply a way to contextualize the average difference in winning percentage. The number .179 may not intuitively seem large, in the context of an eight game conference schedule, it means nearly an extra game and a half in the standings.
Not only was Navy better than the sum of their parts under Niumatalolo, they also sprung quite a few upsets. In fact, they pulled off the most upsets in AAC play since joining the conference in 2015.
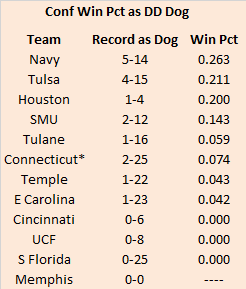
What's that you say? This table is devoid of context. Perhaps Navy pulled so many upsets because they were an underdog more often than everyone else. You make a great point. Context is important. Not only did the Midshipmen pull the most upsets as a conference underdog, they also had the second best winning percentage as an underdog in conference games.
Navy pulled the most upsets, and they also pulled the most big upsets.
Navy won five conference games as an underdog of ten points or more, with four of the five victories coming over the past two seasons. And once again, it wasn't a function of them playing the most game as a double digit underdog. The Midshipmen also had the best winning percentage of any AAC team as a double digit underdog. Also, props to Memphis for avoiding being a double digit conference underdog for the past eight seasons.
Niumatalolo was replaced as head coach by defensive coordinator Brian Newberry. Newberry has been the defensive coordinator for the past four seasons (three of which were losing campaigns I might add). Will the Midshipmen continue to overachieve (at least relative to YPP) under Newberry or did Niumatalolo have some Bill Snyder magic that is impossible to replicate? We'll find out over the next few years. Or maybe we won't.


No comments:
Post a Comment