Here are the 2023 AAC standings.
So we know what each team achieved, but how did they perform? To answer that, here are the Yards Per Play (YPP), Yards Per Play Allowed (YPA) and Net Yards Per Play (Net) numbers for each AAC team. This includes conference play only, with the championship game not included. The teams are sorted by Net YPP with conference rank in parentheses.
College football teams play either eight or nine conference games. Consequently, their record in such a small sample may not be indicative of their quality of play. A few fortuitous bounces here or there can be the difference between another ho-hum campaign or a special season. Randomness and other factors outside of our perception play a role in determining the standings. It would be fantastic if college football teams played 100 or even 1000 games. Then we could have a better idea about which teams were really the best. Alas, players would miss too much class time, their bodies would be battered beyond recognition, and I would never leave the couch. As it is, we have to make do with the handful of games teams do play. In those games, we can learn a lot from a team’s YPP. Since 2005, I have collected YPP data for every conference. I use conference games only because teams play such divergent non-conference schedules and the teams within a conference tend to be of similar quality. By running a regression analysis between a team’s Net YPP (the difference between their Yards Per Play and Yards Per Play Allowed) and their conference winning percentage, we can see if Net YPP is a decent predictor of a team’s record. Spoiler alert. It is. For the statistically inclined, the correlation coefficient between a team’s Net YPP in conference play and their conference record is around .66. Since Net YPP is a solid predictor of a team’s conference record, we can use it to identify which teams had a significant disparity between their conference record as predicted by Net YPP and their actual conference record. I used a difference of .200 between predicted and actual winning percentage as the threshold for ‘significant’. Why .200? It is a little arbitrary, but .200 corresponds to a difference of 1.6 games over an eight game conference schedule and 1.8 games over a nine game one. Over or under-performing by more than a game and a half in a small sample seems significant to me. In the 2023 season, which teams in the AAC met this threshold? Here are AAC teams sorted by performance over what would be expected from their Net YPP numbers.Tulane and Memphis exceeded their expected record based on YPP while UAB fell short of theirs. Tulane and Memphis won all (or at least most) of the close ones, finishing a combined 7-1 in one-score conference games. Meanwhile, UAB was not unlucky in one-score league games, finishing 1-1 in such contests. Turnover margin also doesn't do a good job of explaining the dissonance between their expected record based on YPP and their actual record. The Blazers had a mediocre -1 turnover margin in league play. Once you dig deeper though, you find the culprit was fourth down success and red zone scoring. The Blazers went for it 18 times on fourth down in conference play and converted exactly half the time. Their defense faced 24 fourth down attempts and allowed 16 conversions. That is roughly seven hidden turnovers spread out over the course of an eight game conference slate. While the Blazers were about average in terms of fourth down success on offense, they struggled mightily in scoring touchdowns in the red zone. They had 31 red zone drives in league play and scored touchdowns on less than half of them (15). Meanwhile, their defense allowed 41 red zone drives and opponents netted a touchdown nearly 70% of the time (28). The Trent Dilfer hire was widely mocked, but fourth down conversions and red zone success can shift in the blink of an eye. I wouldn't be shocked if UAB returned to the postseason and contended for the AAC crown next season.
The Worst Unbeatens
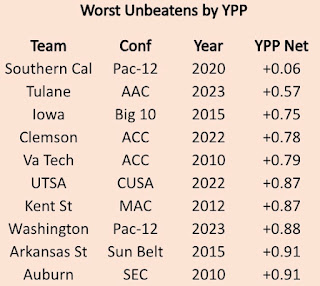
Ugliest supermodel, poorest billionaire, flabbiest bodybuilder. These are pejoratives most people would happily embrace. When humans developed numbers to classify and group things, the natural consequence was that someone or something would inevitably be the worst of that group. And in 2023, the Tulane Green Wave became the worst college football team to finish unbeaten in conference play (since 2005 using by my preferred YPP metric among teams that played a full conference schedule). It doesn't sound quite as impressive with all those caveats, but believe me, it is. For your viewing and reminiscing pleasure, the ten worst teams by YPP to finish unbeaten in conference play since 2005.
No team will probably ever top Southern Cal's shortened 2020 unbeaten run. The Trojans played just five league games as the Pac-12 initially canceled their football season before reversing course and playing an abbreviated schedule beginning in November.
Nine of these unbeaten teams played in conference title games, and despite their middling YPP numbers, they performed quite admirably, especially when they did not face off against another unbeaten (Tulane and Kent State faced off against unbeaten SMU and Northern Illinois teams respectively).
Collectively, the nine teams were 5-4 straight up in their respective conference title games and 6-2-1 ATS. When not facing another unbeaten, they were 5-2 straight up and 6-1 ATS.
Tulane may have failed in their effort to capture a second consecutive league title and they were not as good as their unbeaten record might otherwise indicate. However, winning all your games in league play, no matter the competition, is something to celebrate.


No comments:
Post a Comment