Thursday, May 27, 2021

2020 Yards Per Play: Sun Belt

We finally made it to the last of the YPP recaps. This week we look back at the Sun Belt.   

Here are the 2020 Sun Belt standings.
So we know what each team achieved, but how did they perform? To answer that, here are the Yards Per Play (YPP), Yards Per Play Allowed (YPA) and Net Yards Per Play (Net) numbers for each Sun Belt team. This includes conference play only, with the championship game not included. The teams are sorted by division by Net YPP with conference rank in parentheses.
College football teams play either eight or nine conference games (typically fewer in 2020, although the Sun Belt almost played all their conference games in 2020). Consequently, their record in such a small sample may not be indicative of their quality of play. A few fortuitous bounces here or there can be the difference between another ho-hum campaign or a special season. Randomness and other factors outside of our perception play a role in determining the standings. It would be fantastic if college football teams played 100 or even 1000 games. Then we could have a better idea about which teams were really the best. Alas, players would miss too much class time, their bodies would be battered beyond recognition, and I would never leave the couch. As it is, we have to make do with the handful of games teams do play. In those games, we can learn a lot from a team’s YPP. Since 2005, I have collected YPP data for every conference. I use conference games only because teams play such divergent non-conference schedules and the teams within a conference tend to be of similar quality. By running a regression analysis between a team’s Net YPP (the difference between their Yards Per Play and Yards Per Play Allowed) and their conference winning percentage, we can see if Net YPP is a decent predictor of a team’s record. Spoiler alert. It is. For the statistically inclined, the correlation coefficient between a team’s Net YPP in conference play and their conference record is around .66. Since Net YPP is a solid predictor of a team’s conference record, we can use it to identify which teams had a significant disparity between their conference record as predicted by Net YPP and their actual conference record. I used a difference of .200 between predicted and actual winning percentage as the threshold for ‘significant’. Why .200? It is a little arbitrary, but .200 corresponds to a difference of 1.6 games over an eight game conference schedule and 1.8 games over a nine game one. Over or under-performing by more than a game and a half in a small sample seems significant to me. In the 2020 season, which teams in the Sun Belt met this threshold? Here are Sun Belt teams sorted by performance over what would be expected from their Net YPP numbers.
Using the .200 standard, Coastal Carolina and South Alabama overachieved relative to their YPP numbers. However, both teams went about it quite differently. Coastal was a good team that ended up with a great record thanks to winning both of their one-score conference games. Meanwhile, South Alabama was a bad team that finished with a middling record. The Jaguars were not especially lucky, finishing with an even 1-1 record in one-score games, but they really wheezed to the finish line after winning their first two conference games. South Alabama was far from dominant in those first two victories, being outgained by about .10 yards per play. However, over their final six contests they were outgained by more than two yards per play. Their overall performance was more indicative of a team that won a single conference game versus one that won thrice as many. The administration at South Alabama was not fooled as they relieved head coach Steve Campbell of his duties after the season was over. 

What are the Chants of a Repeat?
First off, apologies for the bad pun. As I mentioned earlier, the Sun Belt almost played a full conference season in 2020. The only regular season game that did not get played was between Louisiana-Monroe and Troy. Of course, just before the Sun Belt Championship Game, some positive tests and contact tracing prevented it from being played. As a result, we did not get to see a rematch of Costal Carolina and Louisiana-Lafayette. For Louisiana-Lafayette, 2020 was the third consecutive year they won the West division of the Sun Belt. For Coastal Carolina, it marked their best season as an FBS program and cemented their status as one of the most improved teams in all of college football. The Chanticleers improved their conference win total by six full games. In 2019, the Chanticleers won two Sun Belt games, beating Texas State and Troy by a combined four points. In 2020, they went 8-0, becoming the first Sun Belt team to roll through conference play unbeaten since Georgia Southern in 2014. Their six-win improvement is tied for the second largest increase among non-BCS/Group of Five conference teams since 2005 (behind Fresno State's amazing seven win-improvement in 2017). However, at this blog, we don't live in the past. Time marches on, and so do we. What can we expect from Coastal Carolina this season? To help answer that question, I looked at all non-BCS/Group of Five teams that improved their conference record by at least five games from one season to the next. Sixteen teams fit this criteria (an average of about one per season). They are listed in the table below along with their performance the following season. 
With a few exceptions, most notably Air Force in 2015, these teams tended to decline the following season. This makes sense. For teams that don't recruit elite talent, regression's pull is hard to avoid. These sixteen teams declined on average by a little more than two conference games the next season. Take heart Coastal fans. Even if the Chanticleers suffer a similar decline, they would still be in contention for the Sun Belt East title in 2021. In addition, while it would be impossible for Coastal to improve on their 2020 conference win total, perhaps they can join the other four teams that managed to hold their win total steady. Coastal Carolina was a great story in 2020 and they should contend for another division title in 2021, but were I betting on the division, I would probably take a look at a team that plays at a higher elevation.  

Thursday, May 20, 2021

2020 Adjusted Pythagorean Record: SEC

Last week we looked at how SEC teams fared in terms of yards per play. This week, we turn our attention to how the season played out in terms of the Adjusted Pythagorean Record, or APR. For an in-depth look at APR, click here. If you didn’t feel like clicking, here is the Reader’s Digest version. APR looks at how well a team scores and prevents touchdowns. Non-offensive touchdowns, field goals, extra points, and safeties are excluded. The ratio of offensive touchdowns to touchdowns allowed is converted into a winning percentage. Pretty simple actually.

Once again, here are the 2020 SEC standings.
And here are the APR standings with conference rank in offensive touchdowns, touchdowns allowed, and APR in parentheses. This includes conference games only with the championship game excluded. Since teams played a varied number of games (every team in the SEC played at least nine and most of the teams played ten), the rankings are on a per game basis, not raw totals. 
Finally, SEC teams are sorted by the difference between their actual number of wins and their expected number of wins according to APR.
I use a game and a half as an arbitrary line of demarcation to determine if a team significantly over or under-performed relative to their APR. By that standard, a pair of Tigers in Auburn and Missouri significantly overachieved. Auburn was only 2-1 in one-score conference games, but they also scored three non-offensive touchdowns in SEC action while allowing none. Two of those non-offensive touchdowns proved decisive in helping the Tigers snatch victory from the jaws of defeat. A blocked punt that resulted in a touchdown provided the winning margin against Arkansas, while a long interception return touchdown resulted in a likely fourteen-point swing in their thirteen-point win against Tennessee. Meanwhile Missouri managed a 3-0 record in one score conference games to eke out a .500 record despite allowing ten more touchdowns than they scored in SEC play.  

Did the SEC Become the Big 12 (But With Better Players)?
One season after LSU made their a case as the best college football team of the new millennium and perhaps by extension, all time, and two seasons after Clemson did the same, Alabama fielded arguably the best college football team ever in 2020. With all the testing, disjointed schedules, canceled games, and other assorted issues that go along with contesting a college football season in the midst of a global pandemic, its debatable how closely 2020 can be compared to previous seasons. However, you would have to be willfully ignorant to downplay how dominant Alabama was in 2020. The Crimson Tide won twelve of their thirteen games by double digits and those thirteen opponents all happened to be Power Five teams, so there were no cupcakes on the schedule. In the process of winning yet another national title, Alabama became the thirteenth Power Five/BCS conference team to average at least six offensive touchdowns per game in conference play in the APR era (since 2005). The Crimson Tide also scored the most offensive touchdowns of any Power Five/BCS conference team in league play, but since they got to play ten conference games, I'll do my best Ford Frick impression and sully their accomplishment with an asterisk.
If you take a look back at the APR standings a few lines up, you might notice Alabama was not the only SEC offense that was humming in 2020. Ole Miss and Florida also averaged five or more offensive touchdowns per game and five SEC defenses allowed at least four touchdowns per game. In fact, for the first time since I have been tracking APR data (since 2005), SEC teams actually scored more offensive touchdowns in conference play than Big 12 teams. 
Is 2020 an outlier, the result of an odd season played in challenging circumstances, or is this the new normal for the SEC? The SEC may not always outpace the Big 12 in scoring (2020 was their lowest offensive touchdown production in a decade), but SEC teams did average an extra touchdown per game compared to their output in 2005. With the conference consistently getting the best players and the rules of the game tilting ever more in the favor of offense, its hard to envision things going back to the relative Dead-ball Era the SEC experienced in the late aughts. 

Thursday, May 13, 2021

2020 Yards Per Play: SEC

We are hitting the home stretch of our YPP reviews. This week, we examine the SEC.   

Here are the 2020 SEC standings.
So we know what each team achieved, but how did they perform? To answer that, here are the Yards Per Play (YPP), Yards Per Play Allowed (YPA) and Net Yards Per Play (Net) numbers for each SEC team. This includes conference play only, with the championship game not included. The teams are sorted by division by Net YPP with conference rank in parentheses.
College football teams play either eight or nine conference games (typically fewer in 2020, although the SEC bucked that trend). Consequently, their record in such a small sample may not be indicative of their quality of play. A few fortuitous bounces here or there can be the difference between another ho-hum campaign or a special season. Randomness and other factors outside of our perception play a role in determining the standings. It would be fantastic if college football teams played 100 or even 1000 games. Then we could have a better idea about which teams were really the best. Alas, players would miss too much class time, their bodies would be battered beyond recognition, and I would never leave the couch. As it is, we have to make do with the handful of games teams do play. In those games, we can learn a lot from a team’s YPP. Since 2005, I have collected YPP data for every conference. I use conference games only because teams play such divergent non-conference schedules and the teams within a conference tend to be of similar quality. By running a regression analysis between a team’s Net YPP (the difference between their Yards Per Play and Yards Per Play Allowed) and their conference winning percentage, we can see if Net YPP is a decent predictor of a team’s record. Spoiler alert. It is. For the statistically inclined, the correlation coefficient between a team’s Net YPP in conference play and their conference record is around .66. Since Net YPP is a solid predictor of a team’s conference record, we can use it to identify which teams had a significant disparity between their conference record as predicted by Net YPP and their actual conference record. I used a difference of .200 between predicted and actual winning percentage as the threshold for ‘significant’. Why .200? It is a little arbitrary, but .200 corresponds to a difference of 1.6 games over an eight game conference schedule and 1.8 games over a nine game one. Over or under-performing by more than a game and a half in a small sample seems significant to me. In the 2020 season, which teams in the SEC met this threshold? Here are SEC teams sorted by performance over what would be expected from their Net YPP numbers.
LSU and Texas A&M significantly exceeded their expected record based on YPP while Arkansas significantly under-achieved. LSU and Texas A&M combined for a 5-1 record in one-score conference games, leading to their better than expected records. Meanwhile, Arkansas finished 1-3 in one-score conference games, narrowly missing out on program building wins against Auburn, LSU, and Missouri. Before we move on, I wanted to note how bad LSU's defense was and how amazing it is that they managed to finish .500 in conference play. The Tigers allowed over seven yards per play (and they weren't even the worst defense in the conference) and this wasn't the result of a bad game or two skewing their numbers. The Tigers allowed at least seven yards per play in eight of their ten conference games! Despite being routinely gashed, the defense did force a league-best 22 turnovers in SEC play, including nine in their last two regular season games, helping them scrape past two teams they probably had no business beating (Florida and Ole Miss). 

Is the SEC Championship Game Loser an Auto-Fade in Bowl Season?
Did you watch the Cotton Bowl this year? I went to bed at halftime. And I didn't miss much. Oklahoma led Florida 31-13 at the break and ended up winning the game by five touchdowns. Conventional wisdom posits this is one of the irrefutable facts of bowl season: The SEC Championship Game loser lays an egg in their bowl game. Despite the fact that I live in South Carolina, we're into facts at this blog, so I did a deep dive on the SEC silver medalists. 

The SEC Championship Game has been around since 1992, but I limited my analysis to the BCS and College Football Playoff eras (since 1998). We'll start with the BCS era (1998-2013). Here is how those sixteen SEC Championship Game losers fared in their bowl games. 
No matter which way you parse the results (either straight up or against the spread), they don't appear to be a great deal different from flipping a coin. However, there is one thing this generic analysis leaves out. The reason SEC Championship Game losers have a reputation for under-performing in their bowl game is because they are disappointed to not be playing for a national championship. Having to play in the Capital One Bowl instead of the BCS Championship Game is a recipe for a flat performance, or so the theory goes. What if we only looked at SEC Championship Game losers that had legitimate national title aspirations going into the SEC Championship Game? By my count, there were only five such teams in the BCS era: Tennessee in 2001, Alabama in 2008, Florida in 2009, Georgia in 2012, and Missouri in 2013. Outside of Alabama, those teams did surprisingly well in their bowl games. 
SEC Championship Game losers don't appear to have performed more poorly than expected in the BCS era. Maybe things have changed in the Playoff era. With four teams now able to compete for a national title in bowl season, perhaps the SEC Championship Game loser is more despondent and not motivated for their bowl game. In the Playoff era, here is how the seven SEC Championship Game losers have fared in their bowl games. 
As in the BCS era, the overall results don't appear to be much different than what we might find if we flipped a coin to determine the outcomes. Again though, not all SEC Championship Game losers are created equal. What if we limit our analysis to those teams with legitimate national championship aspirations entering the SEC Championship Game. There have been four such teams in the Playoff era: Auburn in 2017, Georgia in 2018, Georgia in 2019, and Florida in 2020. Their bowl performance has been mixed at best.
In the Playoff era, SEC Championship Game losers with national title aspirations have not fared well. However, four games is not nearly a large enough sample to offer any definitive proclamations. Instead of auto-fading the SEC Championship Game loser, you would be much better served reading the tea leaves before their bowl game. Florida had a host of opt-outs prior to the Cotton Bowl and the betting line in the game reflected that. At full strength on a neutral field, Florida would have likely been a slight favorite against Oklahoma. As the spread was more than a touchdown in the other direction, its obvious something a little stronger than motivation was influencing the number. 

Thursday, May 06, 2021

2020 Adjusted Pythagorean Record: Pac-12

Last week we looked at how Pac-12 teams fared in terms of yards per play. This week, we turn our attention to how the season played out in terms of the Adjusted Pythagorean Record, or APR. For an in-depth look at APR, click here. If you didn’t feel like clicking, here is the Reader’s Digest version. APR looks at how well a team scores and prevents touchdowns. Non-offensive touchdowns, field goals, extra points, and safeties are excluded. The ratio of offensive touchdowns to touchdowns allowed is converted into a winning percentage. Pretty simple actually.

Once again, here are the 2020 Pac-12 standings.
And here are the APR standings with conference rank in offensive touchdowns, touchdowns allowed, and APR in parentheses. This includes conference games only with the championship game excluded. Since teams played a varied number of games (some played as many as seven or as few as four), the rankings are on a per game basis, not raw totals. 
Finally, Pac-12 teams are sorted by the difference between their actual number of wins and their expected number of wins according to APR.
I use a game and a half as an arbitrary line of demarcation to determine if a team significantly over or under-performed relative to their APR. By that standard, no team significantly over or underperformed. 

The Pac-12 at Ten
It seems like just yesterday the Pac-10 was busy adding Colorado and Utah to their ranks, but the Buffaloes and Utes have been members for a whole decade. There are fifth graders who have only known Utah as a power conference member and would give you a confused expression if you dared to mention the Big Eight in front of them. There is nothing inherently special about a decade, but as humans, we love nice round numbers, so lets take a look back at how things have played out on the west coast over the preceding ten years. 

If you had to guess which Pac-12 team has the best conference record since the league expanded, who would you say? Maybe Oregon. The Ducks made the inaugural College Football Playoff in 2014 and despite a rough patch in 2016, are the face of football on the west coast. Or maybe Southern Cal. The Trojans have not dominated the Pac-12 South as many thought they would and they have gone through a number of coaches in the past ten years, but they are always near the top of the division standings. Or maybe Washington. Steve Sarkisian made the Huskies mediocre, but Chris Petersen brought them back to national prominence with a playoff bid in 2016 and another Pac-12 title in 2018. Well, if you guessed either of those three teams, you would be wrong. The Pac-12 team with the best conference record since 2011 is...Stanford.
Despite a mediocre run since the 2018 season (13-11 conference record), Stanford banked enough wins over the first half of the decade to edge Southern Cal by a half game at the top of the cumulative Pac-12 standings. Oregon is a game behind Southern Cal and no other team is within seven games of the Ducks. At the other end, newcomer Colorado has posted the worst Pac-12 record since 2011. The Buffaloes won the Pac-12 South with an 8-1 record in 2016, but even with that performance, they finished a game and a half behind Oregon State for last place. The Pac-12 enjoyed a lot of parity this decade with every team except one finishing with a winning conference record in at least one season and a losing conference record in at least one season. The lone exception was Cal. The Bears never finished better than 4-5 in Pac-12 play and have not posted a winning season in conference play since 2009

Stanford is the king of the west when it comes to overall record, but which team has won the most conference titles over the past decade?
Thanks to Covid issues at Washington, Oregon was able to sneak into the Pac-12 Championship Game in 2020 and break a tie with Stanford for most conference titles. The Ducks and Cardinal have accounted for seven of the ten league titles this decade. 

What about division crowns?
Nine of the twelve teams have won at least one division title this decade, including every team in the Pac-12 South. Cal, Oregon State, and Washington State are the only teams to not punch their ticket to the Pac-12 Championship Game. In the aforementioned title game, the Pac-12 North has dominated, going 9-1 against Pac-12 South teams with Southern Cal's victory over Stanford in 2017 representing the lone defeat. 

Thursday, April 29, 2021

2020 Yards Per Play: Pac-12

This week we head out west for our penultimate Power Five YPP review.   

Here are the 2020 Pac-12 standings.
So we know what each team achieved, but how did they perform? To answer that, here are the Yards Per Play (YPP), Yards Per Play Allowed (YPA) and Net Yards Per Play (Net) numbers for each Pac-12 team. This includes conference play only, with the championship game not included. The teams are sorted by division by Net YPP with conference rank in parentheses.
College football teams play either eight or nine conference games (typically fewer in 2020). Consequently, their record in such a small sample may not be indicative of their quality of play. A few fortuitous bounces here or there can be the difference between another ho-hum campaign or a special season. Randomness and other factors outside of our perception play a role in determining the standings. It would be fantastic if college football teams played 100 or even 1000 games. Then we could have a better idea about which teams were really the best. Alas, players would miss too much class time, their bodies would be battered beyond recognition, and I would never leave the couch. As it is, we have to make do with the handful of games teams do play. In those games, we can learn a lot from a team’s YPP. Since 2005, I have collected YPP data for every conference. I use conference games only because teams play such divergent non-conference schedules and the teams within a conference tend to be of similar quality. By running a regression analysis between a team’s Net YPP (the difference between their Yards Per Play and Yards Per Play Allowed) and their conference winning percentage, we can see if Net YPP is a decent predictor of a team’s record. Spoiler alert. It is. For the statistically inclined, the correlation coefficient between a team’s Net YPP in conference play and their conference record is around .66. Since Net YPP is a solid predictor of a team’s conference record, we can use it to identify which teams had a significant disparity between their conference record as predicted by Net YPP and their actual conference record. I used a difference of .200 between predicted and actual winning percentage as the threshold for ‘significant’. Why .200? It is a little arbitrary, but .200 corresponds to a difference of 1.6 games over an eight game conference schedule and 1.8 games over a nine game one. Over or under-performing by more than a game and a half in a small sample seems significant to me. In the 2020 season, which teams in the Pac-12 met this threshold? Here are Pac-12 teams sorted by performance over what would be expected from their Net YPP numbers.
Using the .200 cutoff, three teams saw their actual record differ significantly from their expected record based on YPP. And if we do a little rounding, that number jumps to five. Southern Cal, Stanford, and Colorado all exceeded their expected records and each performed well in close games. The trio combined for a 9-1 record in one-score conference games and the lone defeat came when Stanford hosted Colorado. Meanwhile, Arizona State and UCLA significantly underperformed. The Sun Devils and Bruins were on the other end of the close game spectrum, posting a combined 1-6 record in one-score conference games. 

Can You Count to 70?
If Kevin Sumlin was a dead man walking prior to the Territorial Cup rivalry against Arizona State, Herm Edwards put him out of his misery (metaphorically of course, we wish Kevin Sumlin nothing but the best as he enjoys all his buyout loot) on December 11th. The Sun Devils scored the games first 42 points and led 63-7 late in the third quarter before showing some mercy and only winning 70-7. Thanks to College Football Reference's fantastic Game Finder, I can proudly inform you that  Arizona became just the twenty third Power Five/BCS conference team this century to give up 70 points to a conference opponent (in regulation). Compared to those other twenty two teams that had a steroid aided home run number put on them, how bad was this shellacking?  

Arizona became the fourth Power Five/BCS team to give up 70 points to a conference opponent that did not finish with a winning record (Arizona State finished 2-2 in the pandemic shortened 2020 season). Here are the other teams that managed this feat.
We're cheating a bit here as Arizona State was likely to finish with a winning record over a full season, but at 2-2, the math checks out. Still, its hard to argue against Rutgers having the worst showing among these four teams in allowing 80 points to Rich Rod's first West Virginia team that outside of Rutgers only managed to beat a pair of MAC schools. 

Arizona also became the fifth Power Five/BCS team to give up 70 points to a conference opponent at home. 
Those other teams that gave up 70 points at home were either involved in a competitive shootout (Texas Tech led Oklahoma State in the fourth quarter and was within three points with under five minutes to go) or lost to College Football Playoff contenders (Washington made the playoff in 2016 as did Clemson is 2020 and Michigan missed it by a few inches). Meanwhile, Arizona State finished 2-2. 

When the quality of opponent is combined with the venue, Arizona may have posted the worst conference defeat of any Power Five/BCS team this century. And if they didn't, they were a close second behind Rutgers. 

Thursday, April 22, 2021

2020 Adjusted Pythagorean Record: Mountain West

Last week we looked at how Mountain West teams fared in terms of yards per play. This week, we turn our attention to how the season played out in terms of the Adjusted Pythagorean Record, or APR. For an in-depth look at APR, click here. If you didn’t feel like clicking, here is the Reader’s Digest version. APR looks at how well a team scores and prevents touchdowns. Non-offensive touchdowns, field goals, extra points, and safeties are excluded. The ratio of offensive touchdowns to touchdowns allowed is converted into a winning percentage. Pretty simple actually.

Once again, here are the 2020 Mountain West standings.
And here are the APR standings with conference rank in offensive touchdowns, touchdowns allowed, and APR in parentheses. This includes conference games only with the championship game excluded. Since teams played a varied number of games (some played as many as eight or as few as four), the rankings are on a per game basis, not raw totals. 
Finally, Mountain West teams are sorted by the difference between their actual number of wins and their expected number of wins according to APR.
I used a game and a half as an arbitrary line of demarcation to determine if a team significantly over or under-performed relative to their APR. By that standard, no team saw their actual record differ significantly from their APR.

Divisional Dominance
The Mountain West scrapped its divisional format for the 2020 campaign and emulated the Big 12 by sending the two teams with the best record to the conference title game. For the fourth year in a row, one of those participants was Boise State. While the Broncos ultimately fell to San Jose State in the Mountain West Championship Game, they continued to dominate their divisional brethren. The Broncos managed to play five regular season conference games in 2020 and four of those came against teams that normally play in the Mountain Division of the Mountain West (Air Force, Colorado State, Utah State, and Wyoming). The only Mountain Division member that avoided the Broncos was New Mexico. The Broncos won all four of those games with relative ease and in the process ran their divisional win streak to 19 games. In 2016, the Broncos actually lost back to back games against Mountain Division teams, dropping a classic in Laramie to eventual division champs Wyoming and their regular season finale to Air Force. In the four seasons since, the Broncos have lost four times to Mountain West teams (with two coming in the conference title game), but all those losses have come against teams that play in the West Division (Fresno State twice, San Diego State, and San Jose State). How does this divisional win streak compare to Group of Five teams? Pretty favorably. 
The Broncos own the longest divisional win streak among Group of Five teams. and they will have a chance to make it an even twenty when they travel to Utah State on September 25th. 

Thursday, April 15, 2021

2020 Yards Per Play: Mountain West

This week, we follow Horace Greeley's advice and go west.   

Here are the 2020 Mountain West standings.
So we know what each team achieved, but how did they perform? To answer that, here are the Yards Per Play (YPP), Yards Per Play Allowed (YPA) and Net Yards Per Play (Net) numbers for each Mountain West team. This includes conference play only, with the championship game not included. The teams are sorted by Net YPP with conference rank in parentheses.
College football teams play either eight or nine conference games (typically fewer in 2020). Consequently, their record in such a small sample may not be indicative of their quality of play. A few fortuitous bounces here or there can be the difference between another ho-hum campaign or a special season. Randomness and other factors outside of our perception play a role in determining the standings. It would be fantastic if college football teams played 100 or even 1000 games. Then we could have a better idea about which teams were really the best. Alas, players would miss too much class time, their bodies would be battered beyond recognition, and I would never leave the couch. As it is, we have to make do with the handful of games teams do play. In those games, we can learn a lot from a team’s YPP. Since 2005, I have collected YPP data for every conference. I use conference games only because teams play such divergent non-conference schedules and the teams within a conference tend to be of similar quality. By running a regression analysis between a team’s Net YPP (the difference between their Yards Per Play and Yards Per Play Allowed) and their conference winning percentage, we can see if Net YPP is a decent predictor of a team’s record. Spoiler alert. It is. For the statistically inclined, the correlation coefficient between a team’s Net YPP in conference play and their conference record is around .66. Since Net YPP is a solid predictor of a team’s conference record, we can use it to identify which teams had a significant disparity between their conference record as predicted by Net YPP and their actual conference record. I used a difference of .200 between predicted and actual winning percentage as the threshold for ‘significant’. Why .200? It is a little arbitrary, but .200 corresponds to a difference of 1.6 games over an eight game conference schedule and 1.8 games over a nine game one. Over or under-performing by more than a game and a half in a small sample seems significant to me. In the 2020 season, which teams in the Mountain West met this threshold? Here are Mountain West teams sorted by performance over what would be expected from their Net YPP numbers.
Colorado State and Wyoming were the only Mountain West teams to see their actual record differ significantly from their expected record based on YPP. Both the Rams and Cowboys underachieved. Colorado State had meltdowns on special teams, allowing five such touchdowns in their last two games. This turned a probable loss against Boise State into a blowout and a toss-up game with San Diego State into a loss. For Wyoming, the culprit was close game luck. The Cowboys finished 0-3 in one-score games, losing in overtime to Nevada, by one point to New Mexico, and in a blizzard to Boise State. 

Services Academies Against the Spread
Conventional wisdom holds that service academies (Air Force, Army, and Navy) perform well against the spread (ATS) as underdogs, particularly as large underdogs, and not so well as favorites (especially large favorites). The logic behind that assumption is solid. Service academies run unique offenses that are difficult to prepare for and those offenses tend to depress the number of possessions in a game which leads to increased variance. Theoretically, variance would reward underdogs as less variance would lead to a more 'true' result. Is this conventional wisdom accurate or just another well known fact that is disproven by data? All three service academies have long-tenured coaches so we have a relatively large sample of them in different ATS roles. Let's dive into the data and see what it tells us.

Since this is the Mountain West recap, Air Force comes first alphabetically, and Troy Calhoun is the longest-tenured head coach at a service academy, we'll begin with the Falcons. Here is how the Falcons have performed ATS against FBS opponents in all non-bowl games as a favorite and underdog under Calhoun. 
Conventional wisdom jumps to an early lead. The Falcons have covered just 44% of the time as a favorite under Calhoun, but over 58% of the time as an underdog. What about Army under Jeff Monken?
Monken has been at Army seven years, which represents only half of Calhoun's time at Air Force, but is still enough time to begin to develop a track record. Army's cover record as a favorite under Monken is nearly identical to Air Force's under Calhoun (44%). They have been less successful than Air Force as an underdog, but have still performed much better in that role versus as a favorite. Finally, let's check in on Navy under Ken Niumatalolo
It's eerie how similar the three service academies have performed as favorites. At 45% under Niumatalolo, Navy has done just a smidge better than Air Force and Army. As an underdog, they have covered more than 60% of the time. Cumulatively, the service academies have covered slightly more than 44% of the time as favorites and nearly 58% of the time as underdogs under their current head coaches.
So conventional wisdom seems to hold. However, we were interested in how these teams perform as big favorites or underdogs. Let's look at how the service academies have done as both double-digit favorites and double-digit underdogs. Once again, we'll start with Air Force.
The Falcons are worse as double-digit favorites (40%) than they were as favorites of any size (44%), but they are also worse as double-digit underdogs (55%) than they were as an underdog overall (58%). Does the trend hold for Army?
In a small sample (ten games), the Black Knights are better as a double-digit favorite (50%) than they were as a favorite of any size (44%). Their record as a double-digit underdog (50%), was basically indistinguishable from their record as an underdog of any size (51%). And finally, Navy. 
Like Army, the Midshipmen were slightly better as a double-digit favorite (48%) than they were as a favorite of any size (45%). And like Air Force, they were worse as a double-digit underdog (55%) than they were as an underdog overall (60%). Here is how the service academies stack up cumulatively. 
For the most part, the conventional wisdom holds. It's a long-term losing proposition to back a service academy as a favorite, be it double-digit or otherwise. Conversely, backing a service academy in the underdog role is a long-term winning strategy. However, at least under their current administrations, you'd be better off taking them as smaller underdogs. Don't be bashful just because they aren't catching double-digits.    

Thursday, April 08, 2021

2020 Adjusted Pythagorean Record: MAC

Last week we looked at how MAC teams fared in terms of yards per play. This week, we turn our attention to how the season played out in terms of the Adjusted Pythagorean Record, or APR. For an in-depth look at APR, click here. If you didn’t feel like clicking, here is the Reader’s Digest version. APR looks at how well a team scores and prevents touchdowns. Non-offensive touchdowns, field goals, extra points, and safeties are excluded. The ratio of offensive touchdowns to touchdowns allowed is converted into a winning percentage. Pretty simple actually.

Once again, here are the 2020 MAC standings.
And here are the APR standings with conference rank in offensive touchdowns, touchdowns allowed, and APR in parentheses. This includes conference games only with the championship game excluded. Since teams played a varied number of games (some played as many as six or as few as three), the rankings are on a per game basis, not raw totals. 
Finally, MAC teams are sorted by the difference between their actual number of wins and their expected number of wins according to APR.
I use a game and a half as a line of demarcation to determine whether a team significantly over or under-performed relative to their APR. By that standard, Ball State significantly overachieved and Northern Illinois significantly underachieved. Ball State also overachieved relative to their YPP and we went over some reasons for that last week. Northern Illinois underachieved thanks to a poor record in one-score games. While the Huskies finished 0-6 overall, half of their losses came by a touchdown or less. 

Two Winless Teams
The 2020 college football season was unique to say the least. For many teams, the season did not start on time, and every team dealt with testing, postponements, and canceled games. The quirky schedule was bound to produce some odd results, and it did for the MAC. In 2020, a pair of MAC teams finished conference play without a win. Bowling Green and Northern Illinois combined to go 0-11 in MAC play. Northern Illinois lost by an average of about two touchdowns per game while Bowling Green was abysmal, losing by about five touchdowns per game. Dating back to the 2019 season, the Huskies and Falcons have combined to lose fourteen consecutive MAC games. But I'm not here to mock and gawk at all the losing that has befallen them the past two seasons. I know misery loves company, so I wanted to see how often two teams in a given conference finished winless. I decided to limit my analysis to the BCS and CFB Playoff eras (since 1998). In order for a conference to have two teams finish winless (assuming each team plays a full schedule), it needs to have more teams than conference games. And it doesn't hurt to separate those teams into divisions. While college football divisions existed before the BCS, this date serves as a nice arbitrary divide and gives us nearly a quarter century worth of data to examine. Without further adieu, here are the other conferences to produce multiple winless teams since 1998. 
The WAC expanded to sixteen teams in 1996, but the super-conference was not long for the world. 1998 was the last year of the expanded WAC and the conference continued to hemorrhage teams for the next decade or so until it finally dissolved after the 2012 campaign. In 1998, Hawaii and UNLV not only finished 0-8 in WAC play, they both failed to win any non-conference games, combining for an 0-23 overall record. Their struggles did lead to high-profile coaching changes that were at least moderately successful. Hawaii hired June Jones and was bowl eligible in seven of the next nine seasons, culminating with a Sugar Bowl appearance in 2007. UNLV hired legendary Southern Cal coach John Robinson, and while he left Sin City with a losing record, he guided the Rebels to their third ever bowl appearance in 2000. 
In 1999, the MAC pulled off a unique hat trick. Ball State and Buffalo both finished winless in MAC play and overall. In addition, Marshall, behind the pinpoint accuracy of Chad Pennington, finished unbeaten and ranked tenth in the final AP Poll. Ball State was in the midst of a twenty-one game losing streak that they would not break until October of the following season. Meanwhile, Buffalo at least had the excuse of playing their first season at the FBS level since dropping football after the 1970 season. 
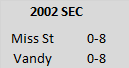
Our first power conference appearance on the list. Mississippi State and Vanderbilt combined for an 0-16 SEC record, but did manage to win five non-conference games. However, Connecticut, Furman, Jacksonville State, Memphis, and Troy were not exactly formidable opponents in 2002.
The MAC is back for another appearance in 2004. Western Michigan did manage to win a game outside the league, trouncing Tennessee-Martin (runteldat) in their opener. Before bolting for Conference USA, UCF closed out their brief MAC tenure by losing all eleven of their games under former Notre Dame coach George O'Leary. The Knights would extend the losing streak to thirteen in 2005 before rallying to win eight of their final nine regular season games and play in the inaugural Conference USA Championship Game.  
The SEC returns for their second appearance on this list. The 2012 campaign was the first year of a fourteen team SEC and marked the final season for Gene Chizik at Auburn and Joker Phillips at Kentucky. However, both schools would make solid hires in Gus Malzahn and Mark Stoops respectively. 
We finally have another power conference that is not the SEC! NC State, in their first season under future Tennessee coach Dave Doeren finished winless in league play and would push their ACC losing streak to twelve games before a victory against Syracuse in November of 2014 broke it. Meanwhile, Virginia somehow beat a solid BYU team to open the season before dropping all eight of their conference games (with seven coming by double digits). 
The 2013 Mountain West saw a good head coach finish without a conference win (Troy Calhoun) and a bad head coach do the same (Norm Chow). Air Force rebounded and won ten games the next season, while Hawaii would finish the Norm Chow era with a 4-25 conference record.
2013 also gave us one final appearance of the SEC on this list. Bret Bielema (Arkansas) and Mark Stoops (Kentucky) both finished winless in conference play in their first season in charge. Bielema got his team to a bowl game faster, winning the Texas bowl the next season, but Stoops had more sustainability. He is still coaching the Wildcats while Arkansas has already hired two head coaches since firing Bielema. 
After 2013, big time losing took a break until 2019. Old Dominion and UTEP combined to lose all their conference games in 2019, but they both won tight games against FCS opponents in their openers to avoid the ignominy of losing all their games. 
Look who decided to join the MAC with a reduced schedule winless campaign in 2020. FIU and UTEP combined for an 0-7 conference record against an abbreviated schedule. By the letter, they meet the requirements, but that 0-7 mark is not even a full season's worth of conference games in normal times. Of course, technically, three Conference USA teams finished winless in league play in 2020 as Old Dominion elected to not play a fall schedule.

There you have it. Those are the conferences that produced multiple winless teams since 1998. Excluding the outlier that was 2020, it happened nine times between 1998 and 2019, which makes it more common than I thought.