Thursday, April 28, 2022

2021 Yards Per Play: Pac-12

We are careening toward the home stretch of our conference reviews. Next up is the Pac-12. 

Here are the 2021 Pac-12 standings. 
So we know what each team achieved, but how did they perform? To answer that, here are the Yards Per Play (YPP), Yards Per Play Allowed (YPA) and Net Yards Per Play (Net) numbers for each Pac-12 team. This includes conference play only, with the championship game not included. The teams are sorted by division by Net YPP with conference rank in parentheses.
College football teams play either eight or nine conference games. Consequently, their record in such a small sample may not be indicative of their quality of play. A few fortuitous bounces here or there can be the difference between another ho-hum campaign or a special season. Randomness and other factors outside of our perception play a role in determining the standings. It would be fantastic if college football teams played 100 or even 1000 games. Then we could have a better idea about which teams were really the best. Alas, players would miss too much class time, their bodies would be battered beyond recognition, and I would never leave the couch. As it is, we have to make do with the handful of games teams do play. In those games, we can learn a lot from a team’s YPP. Since 2005, I have collected YPP data for every conference. I use conference games only because teams play such divergent non-conference schedules and the teams within a conference tend to be of similar quality. By running a regression analysis between a team’s Net YPP (the difference between their Yards Per Play and Yards Per Play Allowed) and their conference winning percentage, we can see if Net YPP is a decent predictor of a team’s record. Spoiler alert. It is. For the statistically inclined, the correlation coefficient between a team’s Net YPP in conference play and their conference record is around .66. Since Net YPP is a solid predictor of a team’s conference record, we can use it to identify which teams had a significant disparity between their conference record as predicted by Net YPP and their actual conference record. I used a difference of .200 between predicted and actual winning percentage as the threshold for ‘significant’. Why .200? It is a little arbitrary, but .200 corresponds to a difference of 1.6 games over an eight game conference schedule and 1.8 games over a nine game one. Over or under-performing by more than a game and a half in a small sample seems significant to me. In the 2021 season, which teams in the Pac-12 met this threshold? Here are Pac-12 teams sorted by performance over what would be expected from their Net YPP numbers.
No team in the Pac-12 significantly over or underachieved relative to their YPP numbers although Colorado and Arizona came close. 

Three Downs
Southern Cal, Stanford and Washington are historically speaking, three of the top programs in the Pac-12. In fact, one could argue they are the best. You can make a case for Oregon, especially if you were born in the 21st century. But for the purposes of this post, lets assume those three are the standard bearers for the Pac-12. Those three teams finished with a combined conference record of 8-19 in 2021. This marked the first time their cumulative conference record was below .500 since 2008 and was only the fifth such occurrence this century. 
Perhaps even more amazing, this was the worst combined conference record for the three programs. Ever. The Pac-12 has gone through a lot of iterations in its history and has even included teams like Idaho and Montana. Yet this trio had never been as bad at the same time as they were in 2021. With those three teams suffering historic downturns, who benefited? You could certainly argue Oregon and Utah, the two conference title game participants, but I would direct your attention a little further down the conference standings. 

Oregon State and Washington State finished a combined 11-7 in Pac-12 play last season. The Beavers and Cougars went a combined 5-1 against Southern Cal, Stanford, and Washington. Oregon State beat all three. Their victory against the Trojans was their first since 2010 (lost previous four). They beat Washington for the first time since 2011 (lost previous nine) and Stanford for the first time since 2009 (lost previous eleven). Washington State beat Washington and Stanford, but lost to Southern Cal. Their victory against the Huskies was their first since 2012 (lost previous seven) and their win against Stanford was actually their fifth in a row against the Cardinal. The problem for middle weights like Oregon State and Washington State is that when programs the caliber of Southern Cal, Stanford, and Washington have bad or disappointing seasons, they often upgrade at head coach. That is precisely what Southern Cal and Washington presumably did in the offseason. The Trojans hired a proven head coach from Oklahoma while Washington hired an up and comer from the Group of Five. Stanford stood pat behind their long tenured head coach, but Southern Cal and Washington are likely to see improvement (perhaps significantly) in 2022. I don't know what to make of Stanford and their decline in recent years, but moderate improvement in Palo Alto would not shock me either. What does this mean for Oregon State and Washington State in 2022? They play all three teams again in 2022 and the odds of them finishing 5-1 (or better) against the trio are slim. Their 11-7 combined record from last season means they went just 6-6 against the rest of their Pac-12 slate. A bowl game for either the Beavers or Cougars is not a sure thing and my initial take would be to look at the 'under' on their season win totals when those numbers are released. 

Thursday, April 21, 2022

2021 Adjusted Pythagorean Record: Mountain West

Last week we looked at how Mountain West teams fared in terms of yards per play. his week, we turn our attention to how the season played out in terms of the Adjusted Pythagorean Record, or APR. For an in-depth look at APR, click hereIf you didn’t feel like clicking, here is the Reader’s Digest version. APR looks at how well a team scores and prevents touchdowns. Non-offensive touchdowns, field goals, extra points, and safeties are excluded. The ratio of offensive touchdowns to touchdowns allowed is converted into a winning percentage. Pretty simple actually.

Once again, here are the 2021 Mountain West standings. 
And here are the APR standings with conference rank in offensive touchdowns, touchdowns allowed, and APR in parentheses. This includes conference games only with the championship game excluded.
Finally, Mountain West teams are sorted by the difference between their actual number of wins and their expected number of wins according to APR. 
I use a game and a half as the standard to determine whether or not a team significantly over or under-performed. No team in the Mountain West met that threshold in 2021. 

The Decline of Boise State
The expression 'life comes at you fast' is a bit trite, but there is a lot of truth in that short statement. We often struggle to recognize gradual change until a significant amount of time has passed. For example, without looking it up, how long has it been since Boise State finished a season ranked in the top ten of the AP Poll? Five or six years right? Longer. Seven or eight? It was 2011. Barack Obama had not completed his first term as President the last time Boise State was considered by the college football media to be among the nation's elite. The Broncos have not exactly been wondering in the wilderness for the past eleven seasons, but their national profile has dimmed and that coincided with the departure of Chris Petersen to Washington. Petersen coached the Broncos for eight seasons (2006-2013) and in an interesting bit of symmetry, the Broncos have been without Petersen for the past eight seasons (2014-2021) and sort of 'became' Boise State in the eight seasons preceding his ascendance to head coach (1998-2005). 

Boise State played their first game as an FBS program on August 31st 1996. They lost to Central Michigan. The Broncos would win just two games in that inaugural season. They followed that up with another losing campaign in 1997, but have reeled off 24 consecutive winning seasons since. As I mentioned earlier, that 24 year run neatly sandwiches their greatest success under Chris Petersen between two pretty good runs under four other coaches. So let's do a little comparison. Here is the conference record Boise State posted during each eight year span along with their number of conference titles, both outright and shared. 
Between 1998 and 2005, the Broncos won nearly 88% of their conference games with five outright league titles and a shared title in 2005. When the Big West folded following the 2000 season, the Broncos did not miss a beat in their new home, the WAC, winning 23 of 24 conference games between 2002 and 2005. Following the 2005 season, head coach Dan Hawkins took the Colorado job and his offensive coordinator, Chris Petersen, was promoted to head coach. And the Broncos kept on winning. During Petersen's eight years in charge, they upped their conference winning percentage ever so slightly to nearly 91%. However, they won fewer conference titles, both outright (3) and shared (2) thanks to generational teams at Hawaii (2007) and Nevada (2010) and the move to a stronger conference (the Mountain West in 2011). Once Petersen departed, Bryan Harsin was plucked from Arkansas State to lead the team. Under Harsin and his successor Andy Avalos, the Broncos have continued to dominate their conference brethren. They have won 82% of their Mountain West games and claimed the conference title outright 3 times with two other appearances in the league title game. In fact, they made four consecutive conference title appearances between 2017 and 2020. So if the Broncos are still winning conference games at a similar clip, why have they not finished in the top ten in more than a decade?
This is the biggest area where Boise State has fallen off. Under Dirk Koetter and Dan Hawkins, the Broncos dominated their conference opponents, but were unable to score any major non-conference victories. Between 1998 and 2005, they beat two teams from BCS conferences. They beat an Iowa State team that finished 7-7 in the 2002 Humanitarian Bowl and Oregon State in 2004. Their two wins against ranked teams in that span came against Fresno State in 2001 and TCU in the 2003 Fort Worth Bowl. Under Petersen, the Broncos more than quadrupled their win total against BCS conference teams, winning games against Georgia, Oklahoma, Oregon, and Virginia Tech to name a few. They also won twice as many games as they lost against ranked teams, knocking off two top ten teams (Oklahoma and TCU) in the process. While the Broncos have held their own against Power Five teams since Petersen left, they have not scored any genre defining wins. Of their seven victories against Power Five opponents, three have come against teams that finished with losing records (most recently Florida State in 2019) and only one has come against a team that finished the season ranked in the final AP Poll (Arizona). And speaking of ranked teams, while they have beaten seven ranked teams, six of them have been fellow Group of Five members (BYU, Fresno State thrice, San Diego State, and Utah State). The college football viewing public does pay as much attention when Group of Five teams cannibalize their own. 

If the Broncos want to resume their place at the top of the Group of Five food chain in the college football ecosystem, they need to start winning more games against better Power Five opponents. Alas, the 2022 schedule does not really present any opportunities for such a feat. The lone Power Five opponent on the schedule is Oregon State, a bowl team from last season, but an unlikely true contender in the Pac-12. The Broncos do host a future Power Five opponent, BYU, but the 2022 team will at best have a sterling final record with few chances to wow the nation in non-conference action. 

Thursday, April 14, 2022

2021 Yards Per Play: Mountain West

Six conferences down, four to go. After spending the first three months of our reviews in the south, eastern, and midwestern parts of the continental United States, we follow Horace Greeley's advice and head west to a conference that saw a third of its membership win ten games in 2021. 

Here are the 2021 Mountain West standings. 
So we know what each team achieved, but how did they perform? To answer that, here are the Yards Per Play (YPP), Yards Per Play Allowed (YPA) and Net Yards Per Play (Net) numbers for each Mountain West team. This includes conference play only, with the championship game not included. The teams are sorted by division by Net YPP with conference rank in parentheses.
College football teams play either eight or nine conference games. Consequently, their record in such a small sample may not be indicative of their quality of play. A few fortuitous bounces here or there can be the difference between another ho-hum campaign or a special season. Randomness and other factors outside of our perception play a role in determining the standings. It would be fantastic if college football teams played 100 or even 1000 games. Then we could have a better idea about which teams were really the best. Alas, players would miss too much class time, their bodies would be battered beyond recognition, and I would never leave the couch. As it is, we have to make do with the handful of games teams do play. In those games, we can learn a lot from a team’s YPP. Since 2005, I have collected YPP data for every conference. I use conference games only because teams play such divergent non-conference schedules and the teams within a conference tend to be of similar quality. By running a regression analysis between a team’s Net YPP (the difference between their Yards Per Play and Yards Per Play Allowed) and their conference winning percentage, we can see if Net YPP is a decent predictor of a team’s record. Spoiler alert. It is. For the statistically inclined, the correlation coefficient between a team’s Net YPP in conference play and their conference record is around .66. Since Net YPP is a solid predictor of a team’s conference record, we can use it to identify which teams had a significant disparity between their conference record as predicted by Net YPP and their actual conference record. I used a difference of .200 between predicted and actual winning percentage as the threshold for ‘significant’. Why .200? It is a little arbitrary, but .200 corresponds to a difference of 1.6 games over an eight game conference schedule and 1.8 games over a nine game one. Over or under-performing by more than a game and a half in a small sample seems significant to me. In the 2021 season, which teams in the Mountain West met this threshold? Here are Mountain West teams sorted by performance over what would be expected from their Net YPP numbers.
There was a lot of over and underachievement in the Mountain West in 2021. The two teams that faced off in the Mountain West Championship Game, San Diego State and Utah State, significantly overachieved, while a pair of teams that finished with a combined 4-12 conference record (Colorado State and Wyoming) significantly underachieved. San Diego State and Utah State finished a combined 8-0 in one-score conference games, but they went about winning those games in vastly different ways. San Diego State brought a smile to the octogenarian football fans by relying on their defense (best per play defense in the conference) and special teams (Matt Araiza punted brilliantly and kicked field goals adequately). Meanwhile, Utah State aired it out with transfer quarterback Logan Bonner and managed to win a conference title despite the second worst per play defense in the Mountain West. Colorado State and Wyoming cannot pin their underachievement entirely on close game misfortune. While the Rams and Cowboys combined for an 0-3 mark in one-score Mountain West games, my abacus indicates they still went just 4-9 in multi-score Mountain West games. Colorado State's per play numbers are buoyed by their game against New Mexico. The Rams won that game by 29 points, but outgained the Lobos by an absurd four yards per play. In their other seven Mountain West games, the Rams were outgained by 0.18 yards per play (5.93 to 6.11) which still means they underachieved, as they only managed one victory in those seven games. However, that level of underachievement is not nearly as drastic. For Wyoming, the culprit was an inconsistent offense. The Cowboys scored 14 or fewer points in five of their eight Mountain West games (all losses), but scored 96 total points in the other three (of which they won two). A more consistent offense would have resulted in an extra victory or two in Laramie. 

Mediocre Conference Championship Games
The two teams that played in the Mountain West Championship Game last season finished seventh and eighth respectively in Net YPP. The Aggies and Aztecs were not bad, but they were also probably not the best teams in the Mountain West last season. How do they compare to previous championship game participants historically? Since 2005, among Group of Five teams, they have the second smallest combined Net YPP. 
Utah State and San Diego State were beaten by another title game from 2021. However, they can take solace as they have the lowest Net YPP of any title game where neither participant entered with a negative Net YPP. 

While the MAC and Mountain West produced historic conference title games in 2021 (at least in terms of cumulative Net YPP), this phenomenon is not limited to so called mid-majors. Power Five leagues have featured a few battles of mediocrity as well. 
The ACC has been a habitual offender, with the 2008 incarnation grabbing the top spot (that season only one team finished with a conference record more than one game from .500). And don't think we can't see you there SEC. Tennessee's last conference title appearance came in a season when they were actually outgained and outscored in conference play!

Thursday, April 07, 2022

2021 Adjusted Pythagorean Record: MAC

Last week we looked at how MAC teams fared in terms of yards per play. his week, we turn our attention to how the season played out in terms of the Adjusted Pythagorean Record, or APR. For an in-depth look at APR, click hereIf you didn’t feel like clicking, here is the Reader’s Digest version. APR looks at how well a team scores and prevents touchdowns. Non-offensive touchdowns, field goals, extra points, and safeties are excluded. The ratio of offensive touchdowns to touchdowns allowed is converted into a winning percentage. Pretty simple actually.

Once again, here are the 2021 MAC standings. 
And here are the APR standings with conference rank in offensive touchdowns, touchdowns allowed, and APR in parentheses. This includes conference games only with the championship game excluded. 
Finally, MAC teams are sorted by the difference between their actual number of wins and their expected number of wins according to APR. 
I use a game and a half as a somewhat arbitrary line of demarcation to determine whether or not a team's record differed significantly from their APR. By that standard, Northern Illinois and Kent State significantly overachieved, while Toledo significantly underachieved. Northern Illinois and Toledo also saw their actual records differ significantly from their expected records based on YPP and we went over some reasons for that last week. For Kent State, it was a story as old as time. The Golden Flashes went 4-0 in one-score conference games, clinching the MAC East title on the final day of the regular season with a one-point win over Miami when the Redhawks failed on a two-point conversion in overtime. 

Unique Non-Conference Matchups
The corona virus has upended normal life for more than two years. Sports is one of the more trivial aspects of life to have been impacted, but I would argue not all impacts to the sporting world have been negative. While the 2021 college football regular season was more conventional, especially compared to 2020, the postseason was a different story. Five bowl games were canceled and two bowls had to find replacement teams thanks to a rise in Covid-19 cases. One of those bowls that had to adjust on the fly was the Sun Bowl. Originally slated to feature the Miami Hurricanes and Washington State Cougars, Miami withdrew on December 26th. On December 27th, Boise State withdrew from the Arizona bowl leaving Central Michigan without an opponent for the fledgling game. The Sun Bowl acted quickly and secured Central Michigan as Washington State's opponent in the Sun Bowl. Why was this significant? It marked just the nineteenth time a current member of the MAC has faced off with a current member of the Pac-12. If you are unfamiliar, MAC teams predominantly play in the midwest, so their non-conference games against Power Five opponents tend to involve ACC, Big 10, Big 12, or SEC teams. So we got a rare MAC/Pac-12 matchup in the bowl game, but more importantly, it was also the first victory by a current MAC team against a Pac-12 opponent. Technically at least. More on that in a moment. For now, here is the complete list of games between current MAC and Pac-12 teams. 
Some interesting tidbits from this table. 
  • Give credit to Arizona and Utah. They are the only Pac-12 teams brave enough to venture into MAC territory by playing true road games. 
  • Arizona has played seven games against MAC teams, by far the most of any Pac-12 team. 
  • California, Colorado, Stanford, and UCLA have not played any games against current MAC teams. Technically. 
  • Buffalo and Ohio are the only current MAC teams that have never played a Pac-10/12 opponent. 
  • After the real Cold War ended, there was a bit of a Cold War between the MAC and the then Pac-10. There were no MAC/Pac-10 games between 1992 and 2007.  
While the MAC has enjoyed a more stable conference membership that the rest of FBS, there have been some defections (and expulsions) in the league's history. Alas, the former MAC members were never able to deliver a victory against Pac-10/12 opponents. 
As we did previously to Arizona and Utah, let's give some credit to Colorado as the Buffaloes traveled to the east coast to play Massachusetts in 2014. Also note the 2009 Eagle Bank Bowl was the first bowl game to feature a clash of MAC/Pac-10/12 teams. Temple had a double-digit lead at halftime, but was held scoreless in the second half as the Bruins secured the victory. Marshall is the only former MAC team to never face a Pac-10/12 opponent while they were a member of the MAC.

Finally, as I mentioned earlier, while this is technically the MAC's first victory against a Pac-10/12 team, the current MAC teams have beaten future Pac-12 teams and former or future MAC teams have beaten Pac-10/12 teams. Confused? Let me explain. 
Before Colorado joined the Pac-12, they were a member of the Big 8 and then the Big 12 conference. During that time, they played three games against MAC teams, and even lost one of them

Finally, Northern Illinois (current MAC member), Temple (former MAC member), and UCF (former) have played games against Pac-10/12 opponents before or after they were members of the MAC. 
Future MAC member Temple was able to net a victory against the Pac-10 in the 1979 Garden State Bowl in luxurious New Jersey, while former MAC member UCF bludgeoned Stanford when the Cardinal traveled across the country in 2019. 

The 2021 Sun Bowl was an extemporaneous delight. Instead of a boring clash between middling Power Fives, we were witness to the MAC's first victory against the Pac-12. Oh, and we got to see Jim McElwain doused with Frosted Flakes. 
They're grrrrrrrrrreat!

Thursday, March 31, 2022

2021 Yards Per Play: MAC

We are now beginning the second half of our conference reviews. This week, we will examine the Big 10's little brother, the MAC. 

Here are the 2021 MAC standings. 
So we know what each team achieved, but how did they perform? To answer that, here are the Yards Per Play (YPP), Yards Per Play Allowed (YPA) and Net Yards Per Play (Net) numbers for each MAC team. This includes conference play only, with the championship game not included. The teams are sorted by division by Net YPP with conference rank in parentheses.
College football teams play either eight or nine conference games. Consequently, their record in such a small sample may not be indicative of their quality of play. A few fortuitous bounces here or there can be the difference between another ho-hum campaign or a special season. Randomness and other factors outside of our perception play a role in determining the standings. It would be fantastic if college football teams played 100 or even 1000 games. Then we could have a better idea about which teams were really the best. Alas, players would miss too much class time, their bodies would be battered beyond recognition, and I would never leave the couch. As it is, we have to make do with the handful of games teams do play. In those games, we can learn a lot from a team’s YPP. Since 2005, I have collected YPP data for every conference. I use conference games only because teams play such divergent non-conference schedules and the teams within a conference tend to be of similar quality. By running a regression analysis between a team’s Net YPP (the difference between their Yards Per Play and Yards Per Play Allowed) and their conference winning percentage, we can see if Net YPP is a decent predictor of a team’s record. Spoiler alert. It is. For the statistically inclined, the correlation coefficient between a team’s Net YPP in conference play and their conference record is around .66. Since Net YPP is a solid predictor of a team’s conference record, we can use it to identify which teams had a significant disparity between their conference record as predicted by Net YPP and their actual conference record. I used a difference of .200 between predicted and actual winning percentage as the threshold for ‘significant’. Why .200? It is a little arbitrary, but .200 corresponds to a difference of 1.6 games over an eight game conference schedule and 1.8 games over a nine game one. Over or under-performing by more than a game and a half in a small sample seems significant to me. In the 2021 season, which teams in the MAC met this threshold? Here are MAC teams sorted by performance over what would be expected from their Net YPP numbers.
Northern Illinois significantly exceeded their expected record based on YPP, while Toledo significantly underachieved relative to their YPP. Northern Illinois won the MAC West despite posting the worst Net YPP in the division. The Huskies played a preponderance of one-score games in 2021, and won nearly all of them. They finished 6-1 in one-score MAC games, and while the odds were not as much in their favor in non-conference play (1-2 in one-score games), they did beat a Power Five team for the first time since 2017 in the season opener. Meanwhile, Toledo went 0-3 in one-score MAC games. Their three conference losses came by a grand total of eight points while all five of their conference victories came by at least ten points. The Rockets misfortune was also on display in non-conference action, where they lost tight games to Notre Dame and Middle Tennessee State

From Worst to First
Northern Illinois accomplished an almost unprecedented feat in 2021. No, it wasn't winning the MAC. The Huskies appeared in seven MAC Championship Games (including six straight at one point) between 2010 and 2018 (winning four of them). The more unprecedented feat was going from last place in their division (or conference) to first place. Since 2005, it has only happened eleven times in non-BCS/Group of Five leagues. 
Northern Illinois joins Miami, Florida Atlantic, and San Jose State as the only non-BCS/Group of Five teams to win their conference outright the season after finishing in last place. The other teams on this list either lost their respective conference title games or finished tied for first in a league that did not yet stage a conference title game. 

At this blog, we care about the past, but our goal is trying to predict the future. How did the previous ten teams fare the following season? Well, were I a Northern Illinois supporter, tempering my expectations might be a rational course of action. 
Nine of the ten teams declined the following season, with many seeing significant falls. In some cases their are extenuating circumstances. Miami and Southern Mississippi lost their coaches. Central Michigan had to play an abbreviated season due to the pandemic. Coastal Carolina, San Jose State, and Tulsa had to play full seasons after a pandemic impacted or shortened one. However, this is a pretty clear trend. Fresno State was the lone team able to resist regression's mighty pull. These teams all required at least a little good fortune to win their respective divisions after last place finishes. When that good fortune flips to bad, average, or even good, but not quite as good, a decline in record usually follows. Can Northern Illinois continue their hot streak in 2022 or does our old pal regression have something else in store for them?

Thursday, March 24, 2022

2021 Adjusted Pythagorean Record: Conference USA

Two weeks ago we looked at how Conference USA teams fared in terms of yards per play. his week, we turn our attention to how the season played out in terms of the Adjusted Pythagorean Record, or APR. For an in-depth look at APR, click hereIf you didn’t feel like clicking, here is the Reader’s Digest version. APR looks at how well a team scores and prevents touchdowns. Non-offensive touchdowns, field goals, extra points, and safeties are excluded. The ratio of offensive touchdowns to touchdowns allowed is converted into a winning percentage. Pretty simple actually.

Once again, here are the 2021 Conference USA standings. 
And here are the APR standings with conference rank in offensive touchdowns, touchdowns allowed, and APR in parentheses. This includes conference games only with the championship game excluded.
Finally, Conference USA teams are sorted by the difference between their actual number of wins and their expected number of wins according to APR. 
I use a game and a half as a somewhat arbitrary line of demarcation to determine whether or not a team's record differed significantly from their APR. By that standard, UTSA was the only team that saw their expected record differ significantly from their APR. The Roadrunners also exceeded their expected record based on YPP and we went over a few reasons for that last week. 

Conference USA Gets No Regard
Conference USA is dying. If you have been paying attention to the latest round of realignment that statement should not surprise you. Conference USA had 14 football playing members in 2021. Six are leaving for the AAC (Charlotte, FAU, North Texas, Rice, UAB, and UTSA) and three are trying to join the Sun Belt in time for this football season (Marshall, Old Dominion, and Southern Miss). I'm not a lawyer, so I won't make a prediction on whether that trio has to return for a lame duck campaign in Conference USA, but it certainly appears the ship is sinking. Conference USA did respond by admitting four schools that have been FBS nomads (New Mexico State), FBS pariahs (Liberty), and FCS powers (Jacksonville State and Sam Houston State), but the league is not on strong footing. The nine teams that are 'committed' to Conference USA football for the immediate future are located in eight different states. While the league does boast two true rivalries (New Mexico State/UTEP and Middle Tennessee/Western Kentucky), for the most part, these are nine teams that are stuck together because no one else would have them. The mass exodus, coupled with the relatively underwhelming additions means Conference USA will likely be the worst Group of Five conference year in and year out (assuming it survives). This is bad for the members that inevitably have good seasons  in the coming years.  

I think it would be fair to say the (liberal) media did not respect Conference USA in 2021. Remember, UTSA did not end the 2021 with a ranked finish in the AP Poll despite starting 11-0, beating a Power Five team on the road, and finishing 12-2. How can we gauge the media's respect for a conference? One shorthand for respect is preseason rankings. If a Group of Five conference can place a team in the preseason AP Poll, its fair to say that conference (or at least that team) has garnered the media's respect. In the BCS and College Football Playoff era (since 1998), seven conferences have existed outside the power structure of the major conferences. The five that are currently in existence (AAC, CUSA, MAC, Mountain West, and Sun Belt) and two that have departed from this mortal coil (Big West and WAC). How have they done in terms of getting their members ranked in the preseason AP Poll? Glad you asked. 

Unfortunately, the Big West never had a team ranked in the preseason AP Poll. However, the media respected the WAC despite their East Coast bias.
I was surprised that Boise was only in the preseason AP Poll four times before leaving the WAC after the 2010 season. I was also surprised they only accounted for half of the WAC's preseason ranked teams. 

We have covered the defunct conferences, so now we'll take a look at the current Group of Five, starting with the subject of this post, Conference USA.
The total number of teams ranked in the preseason AP Poll is not bad, but the length of time between rankings shows you how much the landscape of college football has changed. Conference USA has not had a team ranked in the preseason poll in nearly 20 years and the last two teams to be ranked in the preseason are now in the Big 12 (TCU) and ACC (Louisville) respectively. 

Conference USA is probably the worst and least respected Group of Five league. The only one that can give it a run for its money is the MAC.
Its been 20 years since the MAC placed a team in the preseason AP Poll and that team is not only a former member of the MAC, but a soon to be former member of Conference USA. Their new home, as previously mentioned, is the Sun Belt.
It took two decades, but the Sun Belt finally placed a team in the preseason AP Poll in 2021. And they did it twice. Until very recently, the Sun Belt was typically the weakest Group of Five conference, but thanks to a shrewd expansion strategy that prioritized geography and legitimate rivalries, they could end up as the top Group of Five conference, especially with the attrition at the top of the AAC.
FYI, in 2013, the AAC retained the Big East's automatic qualifier status for a BCS bowl game, but I still think it makes sense to include it here. The AAC has had a team ranked in the preseason AP Poll for six consecutive seasons and will likely make it seven once the poll comes out this summer. 

And finally, we come to the Group of Five conference that has produced the most preseason AP ranked teams, the Mountain West. 
Before I touch on the obvious, take a moment to appreciate how respected the Colorado State program was in the late 90's and early aughts. The Rams were ranked in the preseason AP Poll in 1998 (as members of the WAC) and again in 2001 and 2003 as members of the Mountain West. While the Mountain West technically has the most instances of Group of Five teams being ranked in the preseason AP Poll, note that nine of those 16 rankings were compiled by teams that currently are, or will soon be in Power Five conferences (BYU, TCU, and Utah). 

They say respect is not given, but earned. If that is indeed the case, Conference USA has a lot of work to do to get back in the national conscience. A special season at UTSA barely registered on the national radar. With the Roadrunners and a host of others leaving the league, Conference USA is poised to become the forgotten FBS conference. 

Tuesday, March 15, 2022

Surprise Major Conference Tournament Winners

Welcome readers. This is the time of year where I typically offer you advice for filling out your NCAA Tournament bracket. Novel I know. However, I don't really have any groundbreaking analysis to give other than I would be hesitant to pick Arizona to make the Final Four. See my post on the tourney that didn't happen from two years ago to find out why. Since I don't have any advice, I figured I'd offer a history lesson instead. During major conference tournaments, we often see upsets where teams with no chance to earn at at-large bid to the NCAA Tournament win a game or two and set themselves up to earn their conferences automatic bid. Such a run happened this season with Virginia Tech storming through a down ACC (after surviving their opening tourney game with Clemson) to claim the automatic bid. This caused me to wonder, how often has a team with no at-large ambitions gone on a hot streak and won a major conference tournament? We'll classify teams that earned a double-digit seed despite winning their conference tournament as a team with no at-large hopes. To answer that question, we first need to define what a major conference is. Most would argue, there are currently six major conferences in Division I basketball: The fives leagues that form the Power Five in FBS football (ACC, Big 10, Big 12, Pac-12, and SEC) plus the Big East. Some might argue the American and Atlantic 10 are in the same neighborhood. I would respectfully disagree. However, that only addresses the current batch of major conferences. Since the NCAA expanded the tournament to 64 teams in 1985, some now defunct leagues could rightly lay claim to being major conferences. And that is where our journey will start, with a long forgotten conference: The Metropolitan Collegiate Athletic Conference, or as it was known in its time, simply The Metro. 

The Metro was a small conference in 1985. It consisted of eight members that played FBS football as Independents: Cincinnati, Florida State, Louisville, Memphis (then known as Memphis State), South Carolina, Southern Miss, Tulane, and Virginia Tech. The conference produced a Final Four team in 1985 (Memphis) and the national champion in 1986 (Louisville). The Metro would last until 1995 at which point it (sort of) merged with another major conference to form a new major conference. More on that in a moment. Between 1985 and 1995, the league only had one tournament champion that would have been unlikely to make the tournament had they not won the title. 
In 1987, Memphis was on probation, so the league did not send a team to the NCAA Tournament. In 1995, the final year of the league's existence, Louisville entered the conference tournament with a mediocre 16-13 record, but won the title by beating another team with no at-large chances (Southern Miss) to earn the automatic bid. 

I mentioned The Metro (sort of) merged with another conference after the 1995 season. What conference was that? The Great Midwest of course. The Great Midwest existed for all of four seasons (1992-1995), never had more than seven members, but always sent at least three teams to the NCAA Tournament. Cincinnati won all four of the conference tournaments and never received a seed lower than 8, so we can assume they would have been in had they not earned the automatic bid.  
When The Metro and The Great Midwest merged, Conference USA was born. In the early years, the league appeared to have been engineered in a lab by a pandering right wing politician as it operated with three divisions named, you guessed it, Red, White, and Blue. That divisional set up lasted just two seasons before the league cribbed from baseball and reconfigured to American and National. For the first ten years of its existence, Conference USA was a major conference. The league routinely got multiple teams into the tournament and produced legitimate title contenders in Cincinnati, Louisville, and Marquette. However, conference expansion, driven by football, poached the league's best members and by 2006 it was like a lesser version of the current West Coast Conference, with Memphis playing the role of Gonzaga until John Calipari left for Kentucky. Between 1996 and 2005, Conference USA averaged 3.8 NCAA tournament bids per season and always put at least two teams in in the tournament. Since 2006, Conference USA has sent multiple teams to the NCAA Tournament in a season just four times and has not done it since 2012. In those first ten years, a legitimate Cinderella never won the conference tournament. St Louis (2000) and Charlotte (2001) both received 9 seeds, but they probably would have gotten in had they lost in the conference finals. 
Two other defunct conferences can lay claim to being major conferences during their day. And they also (sort of) merged. The Big 8 was a football power in the 1980s, with Oklahoma and Nebraska routinely turning in top-ten finishes. They were also pretty good at basketball. Oklahoma received four 1 seeds between 1985 and 1990 and Kansas won the national title in 1988. With that kind of power at the top, its no surprise there was only a single Cinderella tournament champ between 1985 and the final year of the conference in 1996. 
Missouri, no doubt auditioning for their eventual move to the SEC, was on probation and ineligible for the 1991 NCAA Tournament despite winning the conference tournament. Two years later they won nearly as many games at the conference tournament (3) as they did in all of conference play (5) to nab the automatic bid and a 10 seed. 

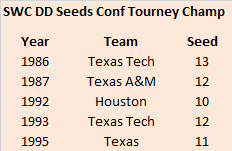
After the 1996 season, driven by football, the Big 8 absorbed four teams from the dying Southwest Conference (Baylor, Texas, Texas A&M, and Texas Tech) to become the Big 12. While the Southwest Conference had some schools with name cache, its basketball performance left a lot to be desired. Between 1985 and 1996, on three occasions, the Southwest Conference sent just one team to the NCAA Tournament! Most damning was that it happened two times in five seasons after their dominant program, Arkansas, realized the ship was sinking and left for the SEC. As you can tell from the seeds some of the conference tournament champions received, the dearth of bids could have been even worse. 
Was the Southwest Conference really a major conference in the late 80s and early 90s? Based on the number of bids and the seeds a few of their conference champs received, you could argue they were closer to the Missouri Valley than...

The Big 12. The conference has not really had a true Cinderella with faint at-large hopes run roughshod through the conference tournament. 
Kansas in 1999 and Iowa State twenty years later earned the lowest seeds of a Big 12 tournament champion. That Kansas team finished tied for second in the regular season behind Texas and while Iowa State was a mediocre fifth in 2019, they were still likely to earn a bid had they not won the tournament. 

As I was compiling the numbers for the ACC, I was shocked the conference has only produced two true Cinderella champions since the NCAA field expanded in 1985. 
NC State entered the 1987 ACC Tournament with a 6-8 conference record (17-14 overall), but upset Duke in the first round, drew a bad Wake Forest team in the second round that had just upset Clemson, and then edged top-seeded North Carolina in the final. Wolfpack fans likely though the Cardiac Pack were back and expected an NCAA Tournament run similar to the one they went on in 1983. Alas, it was not to be as NC State fell to Florida in the first round of the tournament. You could make the case for two other Cinderella runs. Two seasons after winning the national title, Maryland finished 7-9 in the ACC in 2004, but reeled off wins against three Tobacco Road teams (Wake Forest, NC State, and Duke) to claim the tournament title. The Terps were rewarded with a number 4 seed in the ensuing NCAA tournament, implying they may have been in had they lost their ACC Tournament opener. Finally, last season, Georgia Tech won the ACC Tournament thanks in part to a Covid forfeiture in the semifinals by Virginia. However, the Yellow Jackets received a 9 seed, indicating they probably would have still been in had they played and lost to the Cavaliers. 

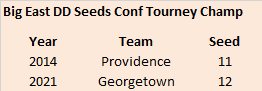
Like the ACC, the Big East has had a lack of legitimate Cinderellas. 
Providence finished tied for third in 2014 and may have been excluded had they dropped the Big East Final to Creighton. And of course, last season saw one of the most improbable runs in major conference tournament history. Georgetown entered the Big East Tournament 9-12 overall and 7-9 in the Big East. The Hoyas then won four games in four days, including a beat down of Creighton in the final to garner a 12 seed. 

The Big 10 did not begin holding a conference tournament until 1998. In the quarter century since they have staged the event, they have had two somewhat surprising winners, but both likely would have gotten in the NCAA Tournament even with a poor performance in the Big 10 Tournament. 
Iowa was 7-9 in Big 10 play in 2001, but won four games in four days to earn the automatic bid. The 7 seed they earned in the NCAA tournament indicated they were likely in as long as they didn't drop the conference opener to last place Northwestern. Michigan was a more respectable 10-8 in Big 10 play in 2017 and despite some aeronautical adventures, they also managed four wins in four days to capture the league tournament. 

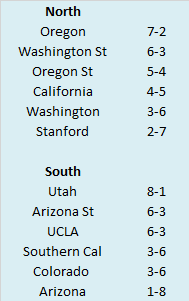
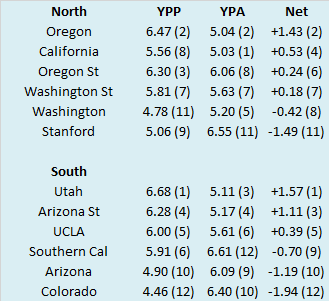
The Pac-12 (then known as the Pac-10) started its conference tournament relatively late in the game (1987) and only contested it for four seasons before putting it on hiatus after 1990. The conference obviously realized the money they were missing out on and resumed it in 2002. In the twenty tournaments the conference has held since it was rebooted, six have been won by teams that did not harbor legitimate at-large hopes heading into the conference tournament. 
The biggest surprise was probably Oregon State in 2021. The Beavers entered the tournament 10-10 in Pac-12 play (and just 14-12 overall) before winning three consecutive games to grab the automatic bid. Their hot streak continued in the NCAA Tournament as they also won three straight to advance to the regional final for the first time since 1982

And finally we come to the SEC, where the biggest major conference tournament Cinderella run occurred. And all it took was an act of god
Aside from Georgia's magical run in 2008, Auburn, Arkansas, and both Mississippi schools have garnered surprise NCAA Tournament bids after winning the SEC Tournament. Georgia received the lowest NCAA Tournament seed (14) of any major conference tournament winner and helped Dennis Felton cash checks for a few more months before he was eventually fired midway through the following season. 

Sorry if you swung by expecting a bracket breakdown or some advice on who to pick in a first round upset. But if you stuck around, I hope you leave with a little more knowledge and an appreciation of all the surprise major conference tournament winners. We'll be back to our normal posting schedule next week, with a look at the Adjusted Pythagorean Record in Conference USA. See you then.