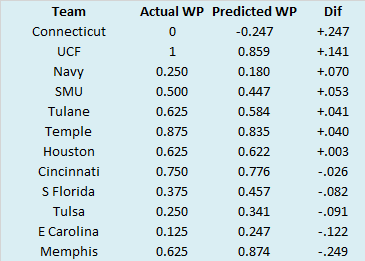
Here are the AAC standings.


In these weekly posts, this is where I take a deeper dive into the statistical minutia of the conference. However, I noticed over the previous offseasons that I just sort of shifted gears into the next topic. No more. We are professionals here on this nearly fourteen year old blogspot account. And there will be headings!
Bettor Beware!
This may have gone unnoticed by you over the bowl season, but I caught it since the team I root for (Wake Forest) was involved. Four ACC teams played in bowl games where they were betting underdogs to Group of Five teams. Obviously, this probably says a lot about the quality of the ACC in 2018, national champ notwithstanding. Three of those ACC teams were underdogs to teams from the AAC. All three of the ACC teams covered and two won outright (the other ACC team had their game canceled). Is the 2018 postseason an isolated incident or are Group of Five teams a bad bet when they are favored against Power Five teams in bowl games? Let’s investigate!
Beginning with the 2005 season, I looked at all bowl games where a non-BCS or Group of Five team was a betting favorite against a BCS or Power Five team. It should go without saying, but the team labels are time sensitive. In other words, while TCU is currently a member of the Big 12, in 2005, when they played Iowa State in the Houston Bowl, they were members of the Mountain West Conference and are included in the analysis. Similarly, their Rose Bowl classic with Wisconsin is also included here (TCU won both games, but pushed against the Cyclones and failed to cover against Wisconsin).
So how did those ‘mid-majors’ do when matching up as a favorite against ‘major’ conference opponents? Since 2005, mid-majors have been favored 29 times against major conference opponents. Overall, they have done well, winning 18 of those 29 contests straight up. However, their Against the Spread (ATS) record is another issue. Mid-majors are just 11-17-1 ATS. The following table breaks the numbers down chronologically with an obvious arbitrary separation.

It does appear that Group of Five teams might not be the ideal choice to back in bowl season when they are favored against Power Five teams. Why might this be so? I have a few theories.
- Motivation. This works for both teams. In the typical G5/P5 clash, the P5 team is usually expected to win and despite the best efforts of their coaching staff, may take the G5 team lightly. Conversely, the G5 team probably has the proverbial chip on their shoulder and is ready to face a team that is higher than them in the college football hierarchy. Some of the individual players from the G5 team may even have extra motivation if both teams are from the same region and the G5 players were not recruited by the P5 team. These roles are subverted in the bowl games where the G5 team is favored. In such cases, the G5 team has usually had a good, but not great season. Perhaps they are disappointed they did not qualify for a New Year’s Six Bowl and are taking their P5 opponent lightly. Meanwhile the P5 team has likely had a disappointing season and may even need a victory in the bowl game to salvage a winning record. Knowing they are underdogs to an ‘inferior’ opponent could provide them with extra motivation in the preparation for and actual playing of the bowl game.
- Loss of quality head coaches. When G5 teams have good seasons, they often lose their coaches. Those coaches often leave between the end of the regular season and the playing of the bowl game. When those coaches leave, an interim is usually appointed to coach the bowl game before the permanent coach and his staff arrive. I never played organized football, but it would seem quite possible this interim coach, despite his qualifications, may have all the respect that a substitute teacher engenders in a high school classroom. Through no fault of the interim coach, the preparation that went into games during the regular season is probably lacking during bowl season. Despite perhaps being the better team, the lack of an effectual (permanent) leader at the top could harm these G5 teams in their bowl games. I didn’t do a deep dive into interim coaches at G5 programs, but anecdotally, the Temple Owls have been favored against P5 teams in two of the last three seasons with an interim coach in charge. The Owls lost both of those games straight up despite being solid to heavy favorites.
- Talent level. Cincinnati was better than Virginia Tech in 2018. That is not a controversial statement. Over the course of twelve games, their actual performance along with randomness inherent in any college football season (in-game turnovers, weather, player dismissals, injuries, etc.) rightly made them a betting favorite against Virginia Tech. However, talent-wise these teams were much closer and Virginia Tech may have had more raw talent. Recruiting rankings are not an infallible proclamation of team strength, but they do a good job of estimating a team’s baseline talent level and in the aggregate, P5 teams have more talent than G5 teams. Sure, some G5 teams will out-recruit P5 teams, but in a random bowl matchup, the P5 team will usually have more talent than the G5 team.
Finally, I apologize for the delay in this post, as I was under the weather last week. However, your patience will be rewarded as there will be two posts this week. The APR AAC post will be up on Thursday and barring any health challenges, posts will resume on a weekly basis every Thursday. Thanks for reading.
No comments:
Post a Comment