Well, the offseason is here. We had a more normal 2021 season with every FBS (regular season) game getting played. If you're new to this blog, first off, welcome. Secondly, this is the part of the year where we examine every FBS conference through the lens of Yards Per Play and the Adjusted Pythagorean Record. We go alphabetically, so if you came for the SEC, well, you'll have to wait until May. In the interim, enjoy a statistical analysis of the other FBS conferences and maybe learn a thing or two.
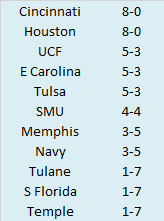
Here are the 2021 AAC standings.
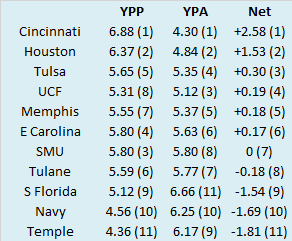
So we know what each team achieved, but how did they perform? To answer that, here are the Yards Per Play (YPP), Yards Per Play Allowed (YPA) and Net Yards Per Play (Net) numbers for each AAC team. This includes conference play only, with the championship game not included. The teams are sorted by Net YPP with conference rank in parentheses.
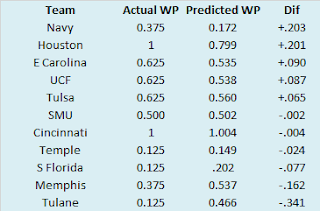
College football teams play either eight or nine conference games. Consequently, their record in such a small sample may not be indicative of their quality of play. A few fortuitous bounces here or there can be the difference between another ho-hum campaign or a special season. Randomness and other factors outside of our perception play a role in determining the standings. It would be fantastic if college football teams played 100 or even 1000 games. Then we could have a better idea about which teams were really the best. Alas, players would miss too much class time, their bodies would be battered beyond recognition, and I would never leave the couch. As it is, we have to make do with the handful of games teams do play. In those games, we can learn a lot from a team’s YPP. Since 2005, I have collected YPP data for every conference. I use conference games only because teams play such divergent non-conference schedules and the teams within a conference tend to be of similar quality. By running a regression analysis between a team’s Net YPP (the difference between their Yards Per Play and Yards Per Play Allowed) and their conference winning percentage, we can see if Net YPP is a decent predictor of a team’s record. Spoiler alert. It is. For the statistically inclined, the correlation coefficient between a team’s Net YPP in conference play and their conference record is around .66. Since Net YPP is a solid predictor of a team’s conference record, we can use it to identify which teams had a significant disparity between their conference record as predicted by Net YPP and their actual conference record. I used a difference of .200 between predicted and actual winning percentage as the threshold for ‘significant’. Why .200? It is a little arbitrary, but .200 corresponds to a difference of 1.6 games over an eight game conference schedule and 1.8 games over a nine game one. Over or under-performing by more than a game and a half in a small sample seems significant to me. In the 2021 season, which teams in the AAC met this threshold? Here are AAC teams sorted by performance over what would be expected from their Net YPP numbers. Navy and Houston significantly exceeded their expected record based on YPP while Tulane drastically under-performed. Counter intuitive to what you might expect, Navy actually had a losing record in one-score conference games, finishing 2-4. However, the Midshipmen had an in-conference turnover margin of +6 which helped keep many of those games closer than they otherwise would have been. In those six one-score conference games, Navy was outgained by 1.40 yards per play! Meanwhile, Houston was 3-0 in one-score conference games and boasted the best in-conference turnover margin (+11). Tulane was 0-3 in one-score conference games and finished tied with Tulsa for the worst in-conference turnover margin (-7).
Big Time Underachievers
You may have noticed in the above chart that Tulane not only met the .200 threshold for underachievement, they blew past it, finishing with a winning percentage more than .340 points below where we would have expected based on their mediocre per play numbers. Are these big time underachievers more likely to rebound the next season that regular underachievers? Short answer: Yes.
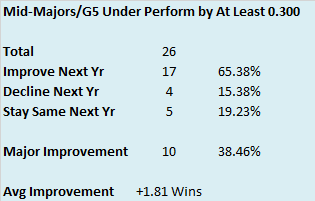
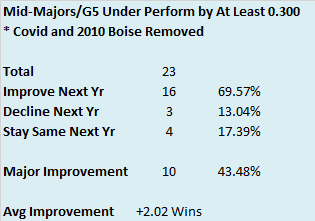
Between 2005 and 2020, 26 mid-majors (Group of Five or non-BCS) teams finished with a conference record at least .300 below their expected record based on YPP. Two teams joined Tulane in accomplishing the feat in 2021 (Colorado State and Wyoming). Those previous 26 teams finished with about 1.8 more conference wins the next season.
Nearly two thirds of the teams improved by at least one conference win and almost 40% of the teams saw major improvement (at least three additional conference wins) the next season. However, when I was sifting through the data, I noticed a few outliers that I felt needed to be addresses. Two of the teams in the sample played in Conference USA in 2020. If you don't remember the 2020 college football season, it was marred by postponements and cancellations. I felt it best not to include those two teams in the sample as they played just four (UTEP) and six (Southern Miss) conference games respectively. Finally, one of the teams in the sample finished with a phenomenal record. In 2010, Boise State finished 7-1 in WAC play, dropping an overtime game to Colin Kaepernick and Nevada, but rolling through the rest of their schedule. Based on their outstanding YPP numbers and the limitations of regression, their expected winning percentage is greater than 1. While they technically under-performed by more than .300, it doesn't make sense to include them in this sample (they were the only team in the sample with a .500 or better conference record). So, when we remove those three teams, the numbers improve slightly. The average improvement jumps to more than two conference wins and nearly 70% of teams in the sample improved.
Willie Fritz is a good coach and the Green Wave have a very manageable
non-conference schedule next year. Coupling that with this trend toward improvement in conference play, I would expect a return to postseason play in 2022.
No comments:
Post a Comment