Last week we looked at how SEC teams fared in terms of yards per play. his week, we turn our attention to how the season played out in terms of the Adjusted Pythagorean Record, or APR. For an in-depth look at APR, click here. If you didn’t feel like clicking, here is the Reader’s Digest version. APR looks at how well a team scores and prevents touchdowns. Non-offensive touchdowns, field goals, extra points, and safeties are excluded. The ratio of offensive touchdowns to touchdowns allowed is converted into a winning percentage. Pretty simple actually.
Once again, here are the 2022 SEC standings.
And here are the APR standings with conference rank in offensive touchdowns, touchdowns allowed, and APR in parentheses. This includes conference games only with the championship game excluded. Finally, SEC teams are sorted by the difference between their actual number of wins and their expected number of wins according to APR. No SEC team saw their actual record differ significantly from their APR.
Biggest Mismatches in Conference Title Games Part II
Last week, we looked at the biggest mismatches in conference title games based on the difference in the participating teams' Net YPP. This week, we are going to do the same exercise, but instead use APR. While I typically list APR as an actual win total, in this table it is listed as a winning percentage so we can get a true measure of the difference since each conference does not play the same number of league games. With that intro out of the way, I present to you the biggest APR conference title game mismatches (since 2005).
The 2022 SEC Championship Game rated as the eight biggest mismatch based on Net YPP and rates a similar seventh in APR. Since 2005, there have been fourteen conference title games where one team entered with an APR at least .300 greater than their opponent. The ACC and MAC have been responsible for eight of those fourteen instances (four apiece). However, the biggest mismatch was the inaugural Pac-12 Championship Game. Oregon was rolling in their third season under Chip Kelly, while UCLA qualified for the title game on a technicality. They actually finished two games behind Southern Cal in the South Division, but the Trojans were ineligible for postseason play.
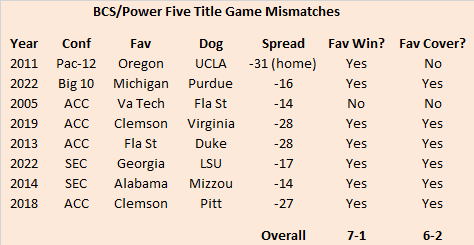
As I mentioned last week, no discussion of mismatches would be complete without a look at how each game played out relative to the betting line. Once again, it is necessary to divide the cohort into BCS/Power Five and non-BCS/Group of Five leagues. Here are the results for the BCS/Power Five conferences.
All eight BCS/Power Five mismatches featured games involving a spread of at least two touchdowns. The favorite won seven of the eight games, with Virginia Tech suffering the lone loss in the inaugural ACC Championship Game in 2005. Favorites also went 6-2 against the spread with Oregon failing to cover their massive spread against UCLA in 2011. Brace yourselves. The non-BCS/Group of Five teams did not fare nearly as well. The spreads were not quite as high at the non-BCS/Group of Five level, but five of six were at least double digits. However, only two of six favorites even won the game outright. And they were a perfect 0-6 against the spread. I mentioned it last week, but it bears repeating, talent is clustered much closer together at the non-BCS/Group of Five level than at the BCS/Power Five level. While these lower tier teams may significantly outplay their conference title opponents over the course of the season, their raw talent levels are usually closer so they have a hard time covering these large numbers.


No comments:
Post a Comment