Three conferences down, seven to go. Our sojourn through the 2016 season takes us to the Big 12. Here are the Big 12 standings.
So we know what each team achieved, but how did they perform? To answer that, here are the Yards Per Play (YPP), Yards Per Play Allowed (YPA) and Net Yards Per Play (Net) numbers for each Big 12 team. This includes conference play only. The teams are sorted by Net YPP with conference rank in parentheses.

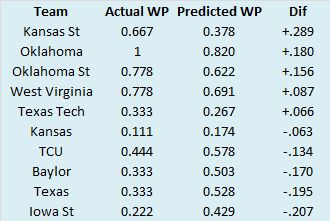
College football teams play either eight or nine conference games. Consequently, their record in such a small sample may not be indicative of their quality of play. A few fortuitous bounces here or there can be the difference between another ho-hum campaign or a special season. Randomness and other factors outside of our perception play a role in determining the standings. It would be fantastic if college football teams played 100 or even 1000 games. Then we could have a better idea about which teams were really the best. Alas, players would miss too much class time, their bodies would be battered beyond recognition, and I would never leave the couch. As it is, we have to make do with the handful of games teams do play. In those games, we can learn a lot from a team’s YPP. Since 2005, I have collected YPP data for every conference. I use conference games only because teams play such divergent non-conference schedules and the teams within a conference tend to be of similar quality. By running a regression analysis between a team’s Net YPP (the difference between their Yards Per Play and Yards Per Play Allowed) and their conference winning percentage, we can see if Net YPP is a decent predictor of a team’s record. Spoiler alert. It is. For the statistically inclined, the correlation coefficient between a team’s Net YPP in conference play and their conference record is around .66. Since Net YPP is a solid predictor of a team’s conference record, we can use it to identify which teams had a significant disparity between their conference record as predicted by Net YPP and their actual conference record. I used a difference of .200 between predicted and actual winning percentage as the threshold for ‘significant’. Why .200? It is a little arbitrary, but .200 corresponds to a difference of 1.6 games over an eight game conference schedule and 1.8 games over a nine game one. Over or under-performing by more than a game and a half in a small sample seems significant to me. In the 2016 season, which teams in the Big 12 met this threshold? Here are the Big 12 teams sorted by performance over what would be expected from their Net YPP numbers.

Kansas State significantly exceeded their expected record based on their YPP numbers and Iowa State missed out on a few wins. For Kansas State, this has become a
yearly refrain. Bill Snyder appears to have hacked football. His teams always seem to have winning records in close games (3-2 in one-score conference games this year), win the turnover battle (+7 in-conference turnover margin was tops in the Big 12), and score in unconventional ways (net +4 in non-offensive touchdowns in conference play was also the best in the Big 12). The
Wildcats' win against Texas Tech was particularly telling about doing the little things to win. Texas Tech outgained Kansas State by over 250 yards and averaged nearly a yard more per play than the Wildcats. However, Kansas State did not turn the ball over and managed to capitalize on the one big mistake the Texas Tech offense made by returning an interception for a touchdown. The Wildcats also returned a kickoff for a touchdown in a game they won by six points. In addition, Kansas State used their ball control offense to limit the possessions in each game and make the outcome more variable, which favors less talented teams. The Wildcats ran and faced the fewest plays in Big 12 action in 2016. Their games saw about eleven fewer plays than the average Big 12 game in 2016, making giving each play and possession in a Kansas State game more high leverage than a typical Big 12 game. On the other end of the spectrum, Iowa State can lay some of blame for their underachievement on close game randomness (1-3 in one-score conference games), but I think the real culprit is their season-long total is boosted by one great game. The Cyclones hosted Texas Tech in the penultimate game of the regular season and
hammered the Red Raiders. Iowa State averaged nearly five yards more per play (9.35 to 4.43 than the Red Raiders) and beat them by more than 50 points. That fine performance bodes well for Iowa State heading into 2017, but it also served to skew their numbers in 2016.
In late-September, Baylor hosted Oklahoma State in the conference opener for both teams. Oklahoma State was unranked and just two weeks removed from a
massive home upset at the hands of Central Michigan (and the
officials). Baylor was ranked in the top-20 after breezing through the non-conference portion of their schedule. Baylor was about a touchdown favorite and won by eleven points. At the time, the result did not seem out of place with what was expected of both teams going into the game. However, looking back on that game with a season’s worth of data, the result is somewhat surprising. After the win, Baylor lost six of their final eight regular season games and finished just 3-6 in Big 12 play. Meanwhile, Oklahoma State won seven in a row after losing to the Bears and finished with a 7-2 conference record. Removing the game they played against each other, Oklahoma State finished five games better than Baylor in Big 12 play (7-1 versus 2-6). With this interesting statistical tidbit in mind, I decided to look at all instances since 2011 of a BCS/Power 5 team beating a conference opponent despite being at least five games worse than them in the standings when removing the game in question. The results are summarized by year in the table below with Big 12 results highlighted.

The Big 12 has incurred six instances of teams winning a game despite being at least five games worse than their opponent in the standings. Some of this is a pure numbers game. The Big 12 and Pac-12 have played nine conference games since 2011, and it is easier to finish five games or more behind a conference opponent when you play an additional game. The ACC and SEC play eight conference games and the Big 10 played eight before 2016. With that in mind, it is not surprising that the Big 12 leads the way with six and the Pac-12 is second with four. Still, the losses Big 12 teams have endured have had a profound impact on the national championship picture. Consider:
In 2011,
Oklahoma State’s loss to Iowa State assuredly cost them a chance to face LSU in the BCS National Championship Game.
In 2012,
Kansas State’s loss to Baylor almost certainly cost them a chance to play Notre Dame in the BCS National Championship Game.
In 2013,
Oklahoma State’s loss to West Virginia prevented the Cowboys from playing host to Oklahoma with a potential spot in the final BCS National Championship Game on the line. The Cowboys entered the game with the Sooners ranked sixth in the country on Championship Saturday. Had they not lost to West Virginia, they would have been unbeaten and probably ranked third behind Ohio State. The Cowboys lost that game and with it, the Big 12 championship to Oklahoma, but had they not lost to West Virginia, the hype surrounding
Bedlam would have been amazing.
In 2015,
Oklahoma lost to Texas in the Red River Rivalry and very nearly cost them a spot in the second College Football Playoff.
It will probably come as no surprise that only one of these sixteen instances happened at the home of the team with the better record. That would be
Texas Tech breaking Oklahoma’s 39-game home streak in 2011. The 2015 Oklahoma/Texas game was at a neutral site, but all the others came on the road. Oklahoma State/Baylor was the only game where the team that ended with the far superior conference record was an underdog. Obviously, it was early enough in the season for the oddsmakers and public to not have a good grasp on how good these teams would be. In 2017, which team(s) will suffer a massive upset at the hands of a conference opponent despite owning a vastly superior record? While we can’t say who it will be, there is a good chance the team(s) will come from the Big 10, Big 12, or Pac-12.


No comments:
Post a Comment