We are entering the home stretch. Just two more conferences to go. This week we examine our final Power Five conference, the SEC.
Here are the SEC standings.
So we know what each team achieved, but how did they perform? To answer that, here are the Yards Per Play (YPP), Yards Per Play Allowed (YPA) and Net Yards Per Play (Net) numbers for each SEC team. This includes conference play only, with the championship game not included. The teams are sorted by division by Net YPP with conference rank in parentheses.

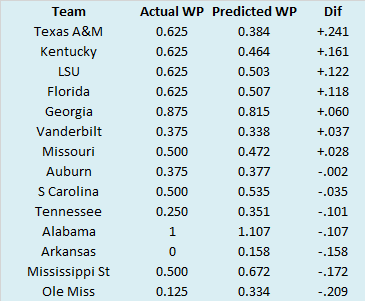
College football teams play either eight or nine conference games. Consequently, their record in such a small sample may not be indicative of their quality of play. A few fortuitous bounces here or there can be the difference between another ho-hum campaign or a special season. Randomness and other factors outside of our perception play a role in determining the standings. It would be fantastic if college football teams played 100 or even 1000 games. Then we could have a better idea about which teams were really the best. Alas, players would miss too much class time, their bodies would be battered beyond recognition, and I would never leave the couch. As it is, we have to make do with the handful of games teams do play. In those games, we can learn a lot from a team’s YPP. Since 2005, I have collected YPP data for every conference. I use conference games only because teams play such divergent non-conference schedules and the teams within a conference tend to be of similar quality. By running a regression analysis between a team’s Net YPP (the difference between their Yards Per Play and Yards Per Play Allowed) and their conference winning percentage, we can see if Net YPP is a decent predictor of a team’s record. Spoiler alert. It is. For the statistically inclined, the correlation coefficient between a team’s Net YPP in conference play and their conference record is around .66. Since Net YPP is a solid predictor of a team’s conference record, we can use it to identify which teams had a significant disparity between their conference record as predicted by Net YPP and their actual conference record. I used a difference of .200 between predicted and actual winning percentage as the threshold for ‘significant’. Why .200? It is a little arbitrary, but .200 corresponds to a difference of 1.6 games over an eight game conference schedule and 1.8 games over a nine game one. Over or under-performing by more than a game and a half in a small sample seems significant to me. In the 2018 season, which teams in the SEC met this threshold? Here are SEC teams sorted by performance over what would be expected from their Net YPP numbers.

Texas A&M and Ole Miss were the two SEC teams that saw their actual record diverge significantly from their expected record based on YPP. The Aggies exceeded their expected record thanks to a 4-1 mark in one-score conference games. Ole Miss was 1-2 in one-score conference games, which is hardly historically unlucky. However, their defense was historically bad (allowed at least 31 points to every conference opponent) which prevented them from winning games despite an above-average offense.
The Best SEC Offense
For most of the 2018 season, the Alabama offense looked like an unstoppable juggernaut. Until their
lackluster showing in the national championship game against Clemson (when they still moved the ball effectively), the Tide had scored at least 24 points in each game and topped 30 points twelve times in their first fourteen games. Even counting their loss to the Tigers, Alabama still averaged over 45 points per game in 2018. That loss obviously left a bad taste in the mouth of Alabama (and SEC) fans, but viewed holistically, the Tide were one of the most dominant offenses of all time. How do they compare to other recent SEC offenses in the two statistics we hold dear around these parts, Yards per Play and APR?
Let’s start with Yards per Play. Here are the top six SEC offenses in terms of raw yards per play since 2005. These numbers include conference play only with the SEC Championship Game excluded (where applicable).
The Tide sure seem like one of the best modern SEC offenses by this metric. They are one of only five SEC offenses to average north of seven yards per play and they are nearly a quarter of a yard per play clear of the second place team (
another incarnation of Alabama that did not win the national title).
Now let’s look at the offensive component of
APR, offensive touchdowns. Once again, here are the top six SEC offenses in terms of offensive touchdowns. These numbers include conference play only with the SEC Championship Game excluded (where applicable).
Once again, Alabama ranks number one in this metric, with Tim Tebow’s
national title winning Gators the only team in the same neighborhood. The four teams tied for third all averaged a full touchdown less per game than Alabama. Well, that’s a pretty open and shut case right? Alabama was clearly the best SEC offense of the past decade and a half. No question about it. Just to be sure, let me run the numbers again, but this time taking into account the scoring environment each team played in. Here are the Yards per Play numbers along with the SEC average for that season. Instead of being sorted by raw totals, the teams are sorted by the difference between their yards per play and the SEC average.
When we adjust for the offensive environment, Alabama still stands out, but another team joins them at the top of the heap. Look at how defenses dominated the SEC in 2008. The average SEC team gained just five yards per play. That’s more than half a yard less than they gained in 2018!
Now let’s do the same thing with offensive touchdowns. Here are the offensive touchdown numbers along with the SEC average for that season. Once again, the teams are sorted by the difference between their offensive touchdowns and the SEC average.
Alabama stands out, but they still can’t shake that 2008 Florida team. SEC teams scored nearly half a touchdown more per game in 2018 than they did in 2008 so Florida’s 44 total touchdowns more than doubled the production of the average SEC offense in 2008!
I went into this analysis thinking Alabama’s 2018 team would rate out as the best SEC offense of recent vintage. However, once an adjustment is made for the uptick in quality of SEC offenses (or downgrade in quality of SEC defenses), the 2008 Florida team is at worst the equal of the Tide and probably a hair better.


No comments:
Post a Comment