Thursday, July 14, 2022

First Half Point Differential: The 2021 Power Five

Last week, we looked at first half point differential in the Group of Five to try and identify some teams that might surprise and or disappoint us this season. This week, we do the same with the Power Five. 

Atlantic Coast Conference
The 2021 ACC standings.
1HPD in ACC play (title game excluded).
No ACC team ran away with a dominant showing in the first half of games in 2021, but the team that finished on top was a surprise. Louisville finished 4-4 in ACC play (more on them later) and were never in contention for the Atlantic crown. While Clemson was in contention for yet another ACC Championship Game appearance heading into Thanksgiving, this iteration of the Tigers was a far cry from their previous dominance. The Tigers had posted first half differentials of 100 points or more in five of their previous six ACC campaigns. 

Big 10 
The 2021 Big 10 standings. 
1HPD in Big 10 play (title game excluded). 
Michigan may have finally won the Big 10 in 2021, but Ohio State was the by far the most dominant team in the conference last season. Elsewhere, there was a lot of trash at the bottom of the league standings, as three teams were outscored by more than 100 points in the first half of their Big 10 games. 

Big 12
The 2021 Big 12 standings. 
1HPD in Big 12 play (title game excluded). 
Yet again, an Oklahoma team finished with the best first half differential in Big 12 play. Unfortunately, the Cowboys dug themselves quite a hole in the Big 12 Championship Game and came within about half a yard of getting out of it. At the bottom of the standings, give a round of applause for Kansas. 2021 marks the first time since I have been tracking first half differential (2014) that the Jayhawks have not finished at least 100 points in the red. 

Pac-12 
The 2021 Pac-12 standings. 
1HPD in Pac-12 play (title game excluded). 
I was shocked by those numbers in the North Division. Oregon finished behind both Washington State and Cal in first half differential. Unfortunately for the Cougars and Bears, wins and losses are the driving force behind division titles. 

SEC
The 2021 SEC standings. 
1HPD in SEC play (title game excluded). 
Georgia was on pace to be one of the best SEC champions of all-time until their lackluster performance in the SEC Championship Game. I'm sure most Georgia fans will take the end result though. Meanwhile, despite winning the SEC in back-to-back years, Alabama showed some vulnerability as evidenced by their relatively low first half differential. Is this a temporary setback (they did play for the national title after all) or a sign that Saban's stranglehold on the sport is slipping ever so slightly?

In the YPP and APR offseason recaps, I sort the teams in each conference by how much they over or under-performed relative to their expected record. Since all the Power Five conferences are grouped together in this post, I am only going to list those that significantly over or under-performed (a difference of at least .200). We'll start with the overachievers.
Michigan State finished with a negative first half point differential yet still managed to win seven of their nine Big 10 games. The Spartans trailed at halftime in eventual victories against Indiana and Michigan and only held a double digit halftime lead in two games (Northwestern and Maryland). Oklahoma was either tied or trailing at the half in five of their nine Big 12 games. In fact the Sooners won every game where they trailed at halftime. The Sooners were only down three at halftime to West Virginia, but they had to pull off double digit comebacks to beat Kansas (10) and Texas (18). Unlike Michigan State and Oklahoma, Oregon actually qualified for their conference title game (the result in that title game was less than ideal). The Ducks trailed at halftime in three Pac-12 games and did the majority of their first half damage against the two worst teams in the conference. If we remove games against Arizona and Colorado, Oregon was outscored in the first half of their other Pac-12 games by sixteen points. 

And now the underachievers. 
As I mentioned earlier, Louisville actually led the ACC in first half point differential yet finished with a .500 conference record. The Cardinals were outstanding in their four ACC victories, holding a halftime lead of at least 14 points in each game (average lead of more than 22 points). Meanwhile, in their four ACC losses, they were tied at halftime twice (Clemson and NC State) and trailed by a field goal in the other two (Virginia and Wake Forest). With a little better luck in 2022, Louisville is an ACC title contender. As they did with YPP and APR, Nebraska also underachieved relative to their first half point differential. Ohio State won all their Big 10 games except the last one, but their point differential was historically great. Texas won three Big 12 games in 2021, but led at halftime in six. They lost four games where they held a halftime lead, but the only big lead they blew was the aforementioned game against Oklahoma. Arizona was not a good team in 2021, but while they only won a single conference game, they were within a touchdown at halftime in six of their nine Pac-12 games. Auburn lost five SEC games in Bryan Harsin's first season. However, they only trailed at halftime twice (Georgia and LSU). The Tigers were either tied (South Carolina and Texas A&M) or winning at halftime (Alabama and Mississippi State) in four of their five SEC defeats!

Thanks for reading. We'll be back in two weeks with some first half point differential superlatives. 

Wednesday, July 06, 2022

First Half Point Differential: The 2021 Group of Five

After a brief respite and a throwback post, we return to contemporary team analysis. This week we'll examine First Half Point Differential (1HPD) in conference play for the Group of Five from this past season. For the uninitiated, 1HPD is a very complicated advanced statistic. It is the number of points by which a team outscored (or was outscored) by its opponents in the first half. The theory behind this stat is that teams that pull off a lot of second half comebacks are operating on razor thin margins and may be in for regression the next season. Similarly, teams that have good first half margins, but end up losing more games than we might expect have a solid foundation to build upon and may see improvement the following season. With that out of the way, lets get started. 

American Athletic Conference
The 2021 AAC standings. 
1HPD in AAC play (title game excluded).
The teams with the two best first half differentials met in the AAC Championship game, with the top team prevailing. At the bottom of the standings, South Florida, Temple, and Tulane all finished with the same conference record (1-7), but its clear from these numbers which team was usually out of the game by halftime. In fact, the Owls never lead at halftime of any conference game in 2020!

Conference USA
The 2021 Conference USA standings. 
1HPD in Conference USA play (title game excluded).
Western Kentucky and UAB posted the best first half differential in 2021 and we were almost treated to a showdown between the Hilltoppers and Blazers in the CUSA Championship Game. However, a last minute comeback by UTSA allowed the Roadrunners to edge the Blazers in the West division race. In the championship game, UTSA against edged a statistically superior team at home giving them their first conference title in school history

Mid-American
The 2021 MAC standings. 
1HPD in MAC play (title game excluded).
Northern Illinois was the ultimate enigma in 2021. The Huskies scoffed at all the statistics that doubted them and hoisted the MAC championship trophy for the fifth time since 2011. In the regular season, the Huskies were tied or trailing at halftime in five of their eight conference games, but jumped on Kent State in the MAC Championship Game posting their largest halftime team lead (17-0) against a MAC foe since they obliterated Akron in 2019. Kent State can take solace that they posted the best first half point differential of any MAC team. I'm sure they hang banners for that. 

Mountain West
The 2021 Mountain West standings. 
1HPD in Mountain West play (title game excluded). 
The Mountain West Championship Game featured the teams ranked third and sixth in first half differential with the sixth ranked team taking home the title. While that may seem like a significant upset, the difference between third and sixth was just fifteen points over the conference season, or less than two per game. Air Force had the best differential, but the Falcons dropped a tight high-scoring game to Utah State early in the season that ultimately determined the division champion.
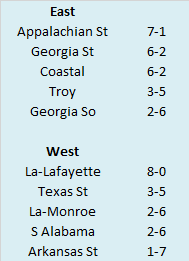
Sun Belt
The 2021 Sun Belt standings. 
1HPD in Sun Belt play (title game excluded). 
Coastal Carolina boasted the best first half differential in Sun Belt action, but Appalachian State won the East division thanks to a thrilling midweek victory against the Chanticleers. The East was where the all the excitement was as Louisiana-Lafayette had the West wrapped up by Halloween, finishing five games clear of the closest competition. The other Louisiana school was revitalized somewhat by retread Terry Bowden, but it might be wise to pump the brakes on a 'Funroe' renaissance. The Warhawks trailed at halftime by nearly twelve points per game in conference play. 

In the YPP and APR offseason recaps, I sort the teams in each conference by how much they over or under-performed relative to their expected record. Since all the Group of Five conferences are grouped together in this post, I am only going to list those that significantly over or under-performed (a difference of at least .200). We'll start with the overachievers.
When a team finishes unbeaten in league play there is usually at least a little bit of good fortune involved. The Cougars only trailed at halftime in two of their eight conference games which is not bad. However, the other unbeaten AAC team (Cincinnati), lead at halftime in all eight of their conference games. North Texas won their final five Conference USA games after an 0-3 start to salvage a bowl bid and perhaps save Seth Littrell's job. However, in that winning streak, the Mean Green had to pull off two second half comebacks (against luminaries Southern Miss and UTEP). Couple that with the extreme negative margins in their first three conference losses and its easy to see why they overachieved relative to their first half differential. In the MAC section, we already touched on how much of an enigma Northern Illinois was in 2021. I'll add the Huskies finished second to last (by a single point over Eastern Michigan) in first half differential in their division. San Diego State only had to pull off one second half comeback in their 7-1 Mountain West campaign, but befitting a team that won with defense (and with their best player potentially being the punter), San Diego State rarely had large leads at halftime. Louisiana-Lafayette rolled through the Sun Belt with a perfect record, but they only led by double-digits at halftime in three of their conference games. 

And now the underachievers. 
I touched on it in the AAC review, but South Florida and Tulane did not have the profile of one-win conference teams. South Florida blew halftime leads in three of their seven conference losses (East Carolina, Houston, and Tulsa) and while Tulane did not blow any second half leads, they were tied with Memphis and trailed by two points against both Cincinnati and Houston at halftime. In the Sun Belt, South Alabama blew double digit halftime leads against Coastal Carolina and Texas State consigning them to a losing record despite a statistical profile that signaled they were a legitimate contender in the conference. 

Thanks for reading. We'll be back next week with a look at first half point differential in the Power Five. 

Thursday, June 23, 2022

YPP Throwback: The 2001 Big 12

I had so much fun revisiting the 2001 SEC last year, I decided to go back to 2001 again and look at the Big 12. We'll begin as always with the 2001 Big 12 standings. 
As with the rest of college football, the 2001 Big 12 season featured a lot of twists and turns. Nebraska, Oklahoma, and Texas all began the year ranked in the top five of the AP Poll. Oklahoma won a low-scoring Red River Shootout to take control of the Big 12 South and were unbeaten when they traveled to Lincoln three weeks later to face Nebraska in a matchup of teams ranked second and third in the AP Poll. The Cornhuskers won 20-10 with Eric Crouch producing his Heisman moment on a trick play reception that iced the game. Heading into the Thanksgiving weekend, it looked like Nebraska and Oklahoma were destined for a rematch in the Big 12 Championship Game, but fate had other plans. Oklahoma lost at home to Oklahoma State giving the South to Texas which had won six in a row (all by double digits) following their defeat in Dallas. In the North, Nebraska entered their regular season finale against Colorado unbeaten, but having failed to clinch the division. Colorado opened the 2001 season by losing to Fresno State. The Buffaloes won their next five games, but were throttled at Texas in mid-October. After losing to the Longhorns, Colorado won their next three games against a middling trio of Big 12 opponents (Oklahoma State, Missouri, and Iowa State) and could steal the division from Nebraska if they managed to upset the Cornhuskers at home. The Buffaloes would do just that, forcing four Nebraska turnovers while rushing for nearly 400 yards in a shocking 62-36 victory. Instead of a rematch between the Cornhuskers and Sooners, we were instead treated to a rematch between the Buffaloes and Longhorns. Texas quarterback Chris Simms played poorly, throwing three interceptions and Colorado led 29-10 late in the first half. Seeking a spark, Mack Brown benched Simms in favor of Major Applewhite and the Longhorns nearly orchestrated a comeback, but Colorado held on to win 39-37. Colorado advanced to the Fiesta Bowl where they fell to Oregon, while Nebraska backed into the Rose Bowl (and BCS title game) thanks to the Big 12 title game upset and upsets in the SEC as well. 

The More Things Change
While Nebraska and Colorado vied for North supremacy in 2001, Kansas finished in the basement. The Jayhawks won a single Big 12 game in 2001 (somehow beating Texas Tech and head coach Mike Leach in Lubbock). Their single victory and was a harbinger of things to come. 
In the Big 12's quarter century of existence, Kansas, Baylor, and Iowa State have dominated the bottom of the standings, with the three combining to win either zero or one conference game an amazing 36 times! The rest of the conference has done it just three times. However, nearly all of Baylor's zero or one win conference campaigns came in the infancy of the Big 12 (more on them in a second) while Kansas is on a thirteen year streak of winning one conference game or less!

Baylor's Historic Ineptitude
The Big 12 began playing football in 1996. The conference maintained the divisional format through 2010 (15 seasons). In that span, Baylor win 18 conference games. And that includes a 4-4 record in 2010 as the program was beginning to coalesce under Art Briles and Robert Griffin. While the 18 wins are bad in isolation, more than two thirds of those victories came in inter-division play. The Bears were bad against Big 12 North teams, but respectable bad. They went 13-32 against the weaker opposition in the Big 12 North, sweeping the division on two occasions (2006 and 2010). However, against Big 12 South teams, the Bears were 5-70 in the fifteen seasons of divisional play! 
The Bears beat a Big 12 South team in their second season (Texas LoL), but did not win another division game for seven years! In fact, they never won more than one division game for the duration of division play!

Where Are the Conference Titles?
Mack Brown took over the Texas Longhorns in 1998 and immediately returned them to national prominence. In his first seven seasons in Austin, the Longhorns averaged ten wins per season (70-19 record), finished ranked each season, and even finished in the top ten of the AP Poll three times. However, the Longhorns did not win a conference title in that span (something his predecessor John Mackovic managed to do in back-to-back seasons). They famously broke through in 2005, but there were a lot of missed opportunities between 1998 and 2004, with 2001 being the prime example. 
Statistically, Texas was the best Big 12 team in 2001. Their defense was the personification of the old adage 'Three Yards and a Cloud of Dust', allowing 3.24 yards per play to league foes. With Future pros like Cory Redding, D.D. Lewis, and Quintin Jammer at all three levels, the unit dominated Big 12 opponents. In addition to the low per play numbers, Texas also allowed just eight offensive touchdowns in Big 12 play during the regular season. Heading into the Big 12 Championship Game, the Longhorns seemed to be catching a break with Colorado upsetting Nebraska. The Longhorns had handled the Buffaloes with ease six weeks before in Austin and were about a touchdown favorite in the rematch. While the aforementioned turnovers by Simms aided Colorado in scoring nearly 40 points, the Buffaloes had the best offensive showing of any Big 12 team against the Longhorns. 
The Buffaloes scored four offensive touchdowns while running back Chris Brown and Bobby Purify combined to gain nearly 250 yards on the ground and average over six yards per carry. The upset added more fuel to the 'can't win the big one' narrative hovering over Mack Brown. Of course, Brown and the Longhorns would prove the doubters wrong by winning the national title in 2005 and adding another Big 12 title in 2009 equaling the total number of conference titles the Longhorns won under his predecessor.  

Final Thoughts
2001 was a weird season for college football. Before 2020, it was the only time I can recall such a massive schedule adjustment. The 9/11 terrorist attacks caused the third full week of the season to be postponed and an additional week to be tacked on to the end of the regular season. Some wild things happened on the field after Thanksgiving, with the aforementioned pair of Colorado upsets along with two more in the SEC (Florida over Tennessee and LSU over Tennessee in the SEC Championship Game) leading to yet another BCS controversy regarding which team was most deserving to take on Miami. In the end, Nebraska earned the nod. Obviously, results on the field have to be taken into account, but based on my YPP look back at the SEC and Big 12, I think Florida or Texas would have provided better competition for the Hurricanes. 

Wednesday, June 01, 2022

2021 Adjusted Pythagorean Record: Sun Belt

Last week we looked at how Sun Belt teams fared in terms of yards per play. his week, we turn our attention to how the season played out in terms of the Adjusted Pythagorean Record, or APR. For an in-depth look at APR, click here. If you didn’t feel like clicking, here is the Reader’s Digest version. APR looks at how well a team scores and prevents touchdowns. Non-offensive touchdowns, field goals, extra points, and safeties are excluded. The ratio of offensive touchdowns to touchdowns allowed is converted into a winning percentage. Pretty simple actually.

Once again, here are the 2021 Sun Belt standings. 
And here are the APR standings with conference rank in offensive touchdowns, touchdowns allowed, and APR in parentheses. This includes conference games only with the championship game excluded.
Finally, Sun Belt teams are sorted by the difference between their actual number of wins and their expected number of wins according to APR. 
I use a game and a half as a somewhat arbitrary standard to determine whether a team's record differed significantly from their APR. By that standard, South Alabama was the only team with a record that was significantly off from their APR. The Jaguars significantly underachieved relative to their APR and they also underachieved relative to their Yards Per Play numbers and we went over a few reasons for that last week.  

Dominating Your Division
Billy Napier had a pretty successful four-year run at Louisiana-Lafayette. The Ragin' Cajuns finished ranked in the AP Poll the past two seasons after never having appeared in the poll in their history. However, Napier's most impressive achievement may have been that he never lost to a division opponent. The Sun Belt switched to a divisional format in 2018 and in the four years since, Louisiana-Lafayette has gone 16-0 against their opponents in the West. 
The Ragin' Cajuns won those sixteen games by nearly fifteen points per game and averaged nearly a yard and a half more per play than their opponents. Perhaps even more impressive is that fact that no other team in the West posted a winning division record in that span. 
And while the East has been the stronger division in the early days of this new Sun Belt iteration, Louisiana-Lafayette has held their own when they step outside the friendly confines of the West. 
The Ragin' Cajuns went 1-3 against East division opponents in Napier's first season, but they are 10-2 since and their overall point and per play differential emphasize this strong showing. In fact, they are the only team from the West to have any success in inter-division play. 
The other West teams all have losing records against the East and that quartet has combined to win less than a quarter of their inter-division games.

Louisiana-Lafayette's amazing division streak is likely to end this season due to simple regression and the reorganization of the Sun Belt. And Billy Napier's personal division streak seems destined to end in Jacksonville if not before, but take a moment to genuflect on some unappreciated dominance at the lower levels of FBS. 

We have completed our offeason run through all ten FBS conferences. Thanks as always for reading. This blog will continue to make posts throughout the summer, but they will be more sporadic. Look for a YPP Throwback on the 2001 Big 12, some posts on first half point differential from this past season, a Vegas betting trip, and maybe an NFL post. We are about twelve weeks from Week Zero, but if we maintain our focus, we can make it through the long offseason. 

Wednesday, May 25, 2022

2021 Yards Per Play: Sun Belt

Somehow, we have arrived at our final conference in the offseason recap series. This week we examine the Sun Belt. 

Here are the 2021 Sun Belt standings. 
So we know what each team achieved, but how did they perform? To answer that, here are the Yards Per Play (YPP), Yards Per Play Allowed (YPA) and Net Yards Per Play (Net) numbers for each Sun Belt team. This includes conference play only, with the championship game not included. The teams are sorted by division by Net YPP with conference rank in parentheses.
College football teams play either eight or nine conference games. Consequently, their record in such a small sample may not be indicative of their quality of play. A few fortuitous bounces here or there can be the difference between another ho-hum campaign or a special season. Randomness and other factors outside of our perception play a role in determining the standings. It would be fantastic if college football teams played 100 or even 1000 games. Then we could have a better idea about which teams were really the best. Alas, players would miss too much class time, their bodies would be battered beyond recognition, and I would never leave the couch. As it is, we have to make do with the handful of games teams do play. In those games, we can learn a lot from a team’s YPP. Since 2005, I have collected YPP data for every conference. I use conference games only because teams play such divergent non-conference schedules and the teams within a conference tend to be of similar quality. By running a regression analysis between a team’s Net YPP (the difference between their Yards Per Play and Yards Per Play Allowed) and their conference winning percentage, we can see if Net YPP is a decent predictor of a team’s record. Spoiler alert. It is. For the statistically inclined, the correlation coefficient between a team’s Net YPP in conference play and their conference record is around .66. Since Net YPP is a solid predictor of a team’s conference record, we can use it to identify which teams had a significant disparity between their conference record as predicted by Net YPP and their actual conference record. I used a difference of .200 between predicted and actual winning percentage as the threshold for ‘significant’. Why .200? It is a little arbitrary, but .200 corresponds to a difference of 1.6 games over an eight game conference schedule and 1.8 games over a nine game one. Over or under-performing by more than a game and a half in a small sample seems significant to me. In the 2021 season, which teams in the Sun Belt met this threshold? Here are Sun Belt teams sorted by performance over what would be expected from their Net YPP numbers.
Louisiana-Lafayette and South Alabama were the two Sun Belt teams that saw their actual record differ significantly from their expected record. In Billy Napier's final season in Lafayette, the Ragin' Cajuns became the first team to finish unbeaten in Sun Belt play and win the conference title game. Despite their unbeaten mark, the Ragin' Cajuns were far from dominant, winning five games by one score. South Alabama was not nearly as fortunate in close games, losing all four conference games they played that were decided by a touchdown or less. The Ragin' Cajuns and Jaguars faced off in early October and the final result was a microcosm of both teams' respective seasons. South Alabama outgained Louisiana-Lafayette and edged them slightly in yards per play. In fact, the Jaguars were in position to take the lead in the fourth quarter, but missed a 36-yard field goal with just over a minute left to seal a 20-18 loss

Divisional Oddities
From the looks of things, the era of divisional play in college football may soon be over. In the three decades of divisional play, there have only been three instances where a the division champ finished with a winning conference record while every other team in the division finished with a losing conference record. Those instances have all come in the past three seasons and the last two have come in the same division! Since this post is on the Sun Belt, you can probably guess which conference is responsible for the last two. 
Louisiana-Lafayette has gone 15-1 in Sun Belt action the past two seasons. In both seasons, the second best team in the division finished 3-5 in Sun Belt play meaning the division was decided before many MLB division races. Before Louisiana-Lafayette's Sun Belt dominance, Oregon finished four games clear of everyone in the Pac-12 North in 2019. And while it didn't quite make the cut, I wanted to remind readers of the mediocrity that was the Big 12 North in 2004. No one in that division finished with a winning record. Iowa State entered the final week of the regular season with a chance to wrap up their first North title, but dropped an overtime game to Missouri to give the division to Colorado. 

Thursday, May 19, 2022

2021 Adjusted Pythagorean Record: SEC

Last week we looked at how SEC teams fared in terms of yards per play. his week, we turn our attention to how the season played out in terms of the Adjusted Pythagorean Record, or APR. For an in-depth look at APR, click here. If you didn’t feel like clicking, here is the Reader’s Digest version. APR looks at how well a team scores and prevents touchdowns. Non-offensive touchdowns, field goals, extra points, and safeties are excluded. The ratio of offensive touchdowns to touchdowns allowed is converted into a winning percentage. Pretty simple actually.

Once again, here are the 2021 SEC standings.
And here are the APR standings with conference rank in offensive touchdowns, touchdowns allowed, and APR in parentheses. This includes conference games only with the championship game excluded.
Finally, SEC teams are sorted by the difference between their actual number of wins and their expected number of wins according to APR. 
I use a game and a half as the standard to determine whether a team's record differed significantly from their APR. By that standard, Missouri and Ole Miss significantly overachieved, while Florida underachieved. The Rebels and Gators also saw their respective records differ significantly from their expected records based on Yards per Play and we went over some reasons why last week. This week, we will focus solely on Missouri. A quick glance at their scoring margin will give you all the information you need to know. Missouri won three SEC games by a combined margin of thirteen points. Contrast that with their five SEC losses, of which four came by at least seventeen points. Their lone competitive conference loss came in the conference opener against Kentucky. 

Upsets in the SEC Championship Game
As you may have heard, Alabama upset Georgia in the SEC Championship game in 2021. It was the first upset in the iconic title game since 2013 when Auburn upset Missouri as a slight underdog on the way to an appearance in the final BCS Championship Game. It marked the sixth upset in the 30-year history of the SEC Championship Game. For your viewing pleasure, the upsets are listed below. 
As I was putting together this list of title game upsets, I noticed something. There have been four significant upsets in the SEC Championship Game (spread of more than a field goal). Three of those upsets have been authored by teams coached by none other than Nick Saban. Two of the upsets kept the defeated team from playing for a national title and the other came against a team an unbeaten juggernaut that had rolled through the regular season. Saban is already considered the greatest college coach of this generation (and perhaps all-time) and this tidbit won't be what most college football fans remember about him, but it is another superlative in his already sterling resume. 

Thursday, May 12, 2022

2021 Yards Per Play: SEC

Hard to believe, but we are now on our penultimate conference in the offseason recaps. This week, we reminisce about the conference that squared off in the College Football Playoff Championship Game, the SEC.

Here are the 2021 SEC standings. 
So we know what each team achieved, but how did they perform? To answer that, here are the Yards Per Play (YPP), Yards Per Play Allowed (YPA) and Net Yards Per Play (Net) numbers for each SEC team. This includes conference play only, with the championship game not included. The teams are sorted by division by Net YPP with conference rank in parentheses.
College football teams play either eight or nine conference games. Consequently, their record in such a small sample may not be indicative of their quality of play. A few fortuitous bounces here or there can be the difference between another ho-hum campaign or a special season. Randomness and other factors outside of our perception play a role in determining the standings. It would be fantastic if college football teams played 100 or even 1000 games. Then we could have a better idea about which teams were really the best. Alas, players would miss too much class time, their bodies would be battered beyond recognition, and I would never leave the couch. As it is, we have to make do with the handful of games teams do play. In those games, we can learn a lot from a team’s YPP. Since 2005, I have collected YPP data for every conference. I use conference games only because teams play such divergent non-conference schedules and the teams within a conference tend to be of similar quality. By running a regression analysis between a team’s Net YPP (the difference between their Yards Per Play and Yards Per Play Allowed) and their conference winning percentage, we can see if Net YPP is a decent predictor of a team’s record. Spoiler alert. It is. For the statistically inclined, the correlation coefficient between a team’s Net YPP in conference play and their conference record is around .66. Since Net YPP is a solid predictor of a team’s conference record, we can use it to identify which teams had a significant disparity between their conference record as predicted by Net YPP and their actual conference record. I used a difference of .200 between predicted and actual winning percentage as the threshold for ‘significant’. Why .200? It is a little arbitrary, but .200 corresponds to a difference of 1.6 games over an eight game conference schedule and 1.8 games over a nine game one. Over or under-performing by more than a game and a half in a small sample seems significant to me. In the 2021 season, which teams in the SEC met this threshold? Here are SEC teams sorted by performance over what would be expected from their Net YPP numbers.
Ole Miss and Florida were the SEC teams that saw their actual record differ significantly from their expected record. The Rebels overachieved by winning both of their one-score conference games and posting the best in-conference turnover margin (+5) of any SEC team. Meanwhile, Florida ended the Dan Mullen era by dropping their final four SEC games. Of their six conference defeats, four came by a touchdown or less. The Gators also had the worst in-conference turnover margin of any SEC team (-8) and were done in by non-offensive touchdowns. In eight conference games, the Gators allowed four non-offensive touchdowns without scoring any of their own. Two of those non-offensive touchdowns provided the exact margin of defeat in games against Kentucky (blocked field goal) and LSU (interception). The other two did not directly result in defeat, but turnovers that resulted in non-offensive touchdowns late in the first half in back to back weeks against Georgia (interception) and South Carolina (fumble) effectively ended any hopes of a Florida comeback. 

Dominating Conference Opponents
Alabama won the 2017 College Football Playoff in dramatic fashion. While the ending was an all-timer, that Alabama team was nondescript compared to other national champions of the modern era (since 1984). However, beginning with Clemson in 2018, the next three national champions (LSU in 2019 and Alabama in 2020) all had a legitimate claims to the be the best of all time. On the morning of December 4, 2021, it appeared Georgia would be able to make a similar claim once the season ended. The Bulldogs entered the SEC Championship Game having beaten ten Power Five opponents by an average of nearly 31 points per game. After a sluggish opener against Clemson in Charlotte, the Bulldogs had not been challenged by any team, leading all their conference opponents by at least a touchdown at halftime en route to the SEC East title. Even a loss to Alabama would not necessarily invalidate their argument as the best team ever. Other great teams like Florida in 2008 or Alabama in 2011 had dropped close games (at home no less) only to regroup and be regarded as some of the best ever once their body of work was examined. It was not the loss to Alabama that curtailed their run at 'best ever' status, it was the magnitude of the defeat. Alabama led by 14 points entering the fourth quarter and pushed their lead to 21 with about twelve minutes left. The 17 point final margin was not misleading. Alabama shredded a previously impenetrable Georgia defense for 526 yards and scored nearly as many points (41) as the Bulldogs allowed in their first seven conference games (49). But you know how this story ends. This was just a temporary setback for Georgia. They rebounded and exorcised their Alabama demons in the College Football Playoff, winning their first national title since 1980. Although, they will probably not go down as they best team ever, they should be remembered for their dominant performance in SEC play. In the BCS era (since 1998), they are one of just eighteen teams to finish unbeaten in conference play and win all their games by double-digits. What illustrious company have they joined? See for yourself, starting with the non-BCS/Group of Five teams. 
No surprise to see a couple Boise State teams on this list. And lets not forget Marshall's dominance of the MAC when they moved up to FBS in the late 90's or the original BCS busters in Salt Lake City. Of course, that's just the appetizer. You probably came for the entree. Here are the BCS/Power Five teams that have finished unbeaten in conference play with each victory coming by at least ten points. 
It may be a little surprising that only three of the nine BCS/Power Five teams that dominated their conference opponents went on to win the national championship (with two coming in the past two seasons). Other observations from the table: The 2000 Miami Hurricanes dominated their Big East brethren more so than the 2001 and 2002 teams that played for national titles. If the College Football Playoff existed in 2000, Bob Stoops may never have won a national title! 2005 was the only time that two BCS/Power Five teams dominated their conference opponents to such an extent in the same season. Finally, Michigan State's dominance in 2013 is often overlooked. The Spartans lacked the offensive firepower of the other teams on this list (note their margin of victory is by far the smallest), but their defense was rock solid in allowing just eleven points per game in Big 10 play. Their lone loss that season was at Notre Dame in a game where they allowed just 17 points

One trend I noticed when conducting this research was the lack of success these dominant teams had in their respective conference title games. Twelve of these teams played in conference title games after their dominant regular seasons. While they did well straight up, they hemorrhaged cash for those betting on them. 
Ten of the twelve were favorites in their respective conference title games. Those ten teams finished 7-3 straight up, but were 1-9 Against the Spread (ATS). Two of the twelve teams were underdogs in their conference title games. The aforementioned Michigan State team faced an unbeaten Ohio State led by Urban Meyer then in his second season in Columbus. The other instance happened in the pandemic-shortened 2020 season when San Jose State faced an unbeaten (in conference play) Boise State team in the Mountain West Championship Game. Both underdogs not only covered, but won the games outright. Why have these dominant favorites performed so poorly ATS in conference title games? Going undefeated is hard. Perhaps the pressure of the moment gets to these teams, especially in an event that is branded as a 'championship'. Or perhaps these massive favorites take their opponents lightly. Their other conference opponents did not put up much resistance throughout the year, so maybe they expect more of the same in the conference title game. Or maybe the oddsmakers have made these numbers too high. The favorites are 7-3 straight up, so they are winning these games, just not covering. Or maybe ten games is too small a sample to draw any significant conclusions from. What do you think? Why have these dominant teams struggled in conference title games? 

Thursday, May 05, 2022

2021 Adjusted Pythagorean Record: Pac-12

Last week we looked at how Pac-12 teams fared in terms of yards per play. his week, we turn our attention to how the season played out in terms of the Adjusted Pythagorean Record, or APR. For an in-depth look at APR, click hereIf you didn’t feel like clicking, here is the Reader’s Digest version. APR looks at how well a team scores and prevents touchdowns. Non-offensive touchdowns, field goals, extra points, and safeties are excluded. The ratio of offensive touchdowns to touchdowns allowed is converted into a winning percentage. Pretty simple actually.

Once again, here are the 2021 Pac-12 standings. 
And here are the APR standings with conference rank in offensive touchdowns, touchdowns allowed, and APR in parentheses. This includes conference games only with the championship game excluded.
Finally, Pac-12 teams are sorted by the difference between their actual number of wins and their expected number of wins according to APR. 
I use a game and a half as the standard to determine whether or not a team's record differed significantly from their APR. By that standard, Colorado significantly overachieved, while Washington significantly underachieved. Despite overachieving, Colorado was still bad in 2021. They did have a dominant win against Arizona, but their other two conference wins both came at home by three points apiece. By comparison, all six of their conference defeats came by at least fifteen points. Meanwhile, Washington was competitive in most of their conference games thanks to their defense. The unit held the Huskies first eight conference opponents to just over 19 points per game. Thanks to their offensive struggles, they were only able to win three of those games. Then, with their bowl dreams dashed and their coach fired, they let go of the rope in the season finale, allowing 40 points to their in-state rivals in The Apple Cup

The Best New Additions
We are on the precipice of another round of conference expansion at the Power Five level. Oklahoma and Texas will soon be members of the SEC while BYU, Cincinnati, Houston, and UCF will replenish the Big 12's membership in quantity if not quality. As we await this brave new world, lets take a moment to reflect on the previous round of realignment that began at the then BCS conference level in 2011 and continued through 2014. In all, twelve schools either switched BCS/Power Five conferences or moved up to BCS/Power Five conferences. An alphabetical listing of those teams in case you forgot: Colorado, Louisville, Maryland, Missouri, Nebraska, Pittsburgh, Rutgers, Syracuse, TCU, Texas A&M, Utah, and West Virginia. 

Which teams have brought the most to their new conference? I don't care about branding, regional penetration, or television markets. At this outpost on the internet, we care about on field performance. To answer that question, lets first look at conference play. The following table lists the twelve newcomers in order of their conference winning percentage. Their number of division titles (or conference championship appearances) and conference titles are also included. 
Only a third of the newcomers have posted winning conference records in their new leagues. A quarter of the newcomers have won conference crowns, but two of them did so in 2021 (Pittsburgh and Utah). If we ran these numbers last summer, TCU's shared title in 2014 would have been the only conference title. Newcomers have appeared in ten conference title games, but they are just 2-8 in such contests, losing by an average of fifteen points per game. 

Conference play is but one area of achievement. We also need to examine national performance. While it is far from a perfect measure, the AP Poll does a good job of capturing the national esteem of teams at a moment in time. Below, the twelve newcomers are sorted by ranked finishes in the top 25 of the AP Poll with top ten finishes also included.
Ten of the twelve teams have finished ranked at least once, with Maryland and Rutgers the lone holdouts. There were six total top ten finishes with schools from Texas (TCU and Texas A&M) accounting for five of them. 

So to answer our original question, which new addition has been the best? I think their are only two potential answers: Texas A&M or Utah. Texas A&M has more top ten finishes that Utah and has a slightly better conference record, but the Utes have more top 25 finishes and have won their division three times (three consecutive times in non pandemic shortened seasons). Texas A&M has a tougher path to a division title, but Utah's conference dominance since 2018 should be recognized (25-7 since the start of 2018). I'll throw my support behind Utah. While it may not be a great sign for the conference when a team with the recruiting profile of Utah is winning it, there is no doubt the Utes have been a good addition. I would also argue that while the SEC has benefited from the addition of Texas A&M, the Aggies have benefited more from their association with the SEC. As for the worst new addition? Hard to make a case for anyone other than Rutgers.