Hard to believe, but we only have two more conferences to review. This week, we head south to the SEC. Here are the SEC standings.
So we know what each team achieved, but how did they perform? To answer that, here are the Yards Per Play (YPP), Yards Per Play Allowed (YPA) and Net Yards Per Play (Net) numbers for each SEC team. This includes conference play only, with the championship game not included. The teams are sorted by division by Net YPP with conference rank in parentheses.

College football teams play either eight or nine conference games. Consequently, their record in such a small sample may not be indicative of their quality of play. A few fortuitous bounces here or there can be the difference between another ho-hum campaign or a special season. Randomness and other factors outside of our perception play a role in determining the standings. It would be fantastic if college football teams played 100 or even 1000 games. Then we could have a better idea about which teams were really the best. Alas, players would miss too much class time, their bodies would be battered beyond recognition, and I would never leave the couch. As it is, we have to make do with the handful of games teams do play. In those games, we can learn a lot from a team’s YPP. Since 2005, I have collected YPP data for every conference. I use conference games only because teams play such divergent non-conference schedules and the teams within a conference tend to be of similar quality. By running a regression analysis between a team’s Net YPP (the difference between their Yards Per Play and Yards Per Play Allowed) and their conference winning percentage, we can see if Net YPP is a decent predictor of a team’s record. Spoiler alert. It is. For the statistically inclined, the correlation coefficient between a team’s Net YPP in conference play and their conference record is around .66. Since Net YPP is a solid predictor of a team’s conference record, we can use it to identify which teams had a significant disparity between their conference record as predicted by Net YPP and their actual conference record. I used a difference of .200 between predicted and actual winning percentage as the threshold for ‘significant’. Why .200? It is a little arbitrary, but .200 corresponds to a difference of 1.6 games over an eight game conference schedule and 1.8 games over a nine game one. Over or under-performing by more than a game and a half in a small sample seems significant to me. In the 2016 season, which teams in the SEC met this threshold? Here are SEC teams sorted by performance over what would be expected from their Net YPP numbers.
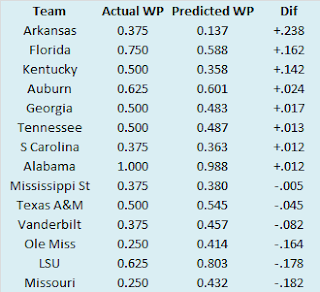
Arkansas was the lone SEC team to significantly over-perform relative to their expected record. Arkansas was not particularly lucky in terms of one-score games (1-1) or turnover margin (-6) in SEC play. No, the Hogs had the profile of a one win conference team thanks to an abysmal defense. The Hogs allowed nearly eight yards per play to SEC opponents and really had only one good defensive showing. They held a limited Florida offense to ten points and under five yards per play. If we remove that game, the Hogs allowed over 8.2 yards per play to their other seven conference opponents. Two teams averaged north of ten yards per play against Arkansas and six conference opponents averaged more than seven yards per play against them.
A few years ago, I penned this
Pulitzer-caliber
post about Les Miles and his uncanny inability to cover the spread (or more accurately his team's inability to cover the spread). Since we are looking at the SEC this week and since Miles' SEC career is over, I decided to reexamine his performance against the spread relative to his conference contemporaries. Let's get degenerate.
Miles coached at LSU eleven full seasons and parts of a twelfth beginning in 2005. In that span, 22 other coaches have spent at least four seasons as SEC head coaches. The following table lists those 23 coaches ranked by their winning percentage against the spread (ATS) in conference games (championship and bowl games excluded). I cheated a little and included Ed Orgeron even though he does not quite have four full seasons under belt since he did succeed Miles at LSU.
A few observations.
- Despite being forced to pay a premium as the most recognized team in college football, backing Nick Saban and Alabama has been a winning proposition for gamblers. Since coming to Tuscaloosa, Saban has covered over 58% of the time against SEC opponents.
- Look at the three Auburn coaches since 2005 with the exact same ATS records. Eerie.
- While he never quite had the reputation in gambling circles of Miles, Mark Richt didn't exactly inspire a lot of ATS confidence for Georgia backers.
- Miles had a winning ATS conference record in just one season, but it was quite a doozy. His 2011 team went 7-1 ATS. If we remove that outlier year, his ATS conference record drops to 29-49-4 (a .372 winning percentage).
- While Miles does not quite bring up the rear, his career is more than double the length of the two men with a worse conference ATS wining percentage.
- And speaking of the guy in last place, he may join Miles in the unemployment line soon if the Aggies continue to struggle relative to their expectations.
So we know Miles was not good at covering the spread, but what if we break things down further. How did his teams perform in different roles. The following table lists LSU's performance ATS versus SEC foes under Miles in the role of favorite, double-digit favorite, and underdog.
Miles was a little better as a favorite, but you would have still made money betting against him in both roles. If nothing else, his teams were consistent as there was not a great deal of difference in their ATS numbers as a standard favorite and a double-digit favorite.
Let's look at one more angle. How did his teams perform ATS at home and on the road against SEC opponents?
So much for that Death Valley aura. On the road, his teams were basically a coin flip to cover, but the Tigers were horrible at home under Miles, covering just over 36% of the time. In fact, in the first four years of his tenure at LSU, his teams covered just once in home conference games!
Miles entertained college football fans for over a decade in Baton Rouge. He brought us a
two-loss national champion, one of the
best teams to not not win the national title, the
Tennnessee Waltz Game,
tried to call a timeout on a change of possession (this was one season before the
ill-fated rule that mandated the game clock start when the play clock started between possessions went into effect so maybe he was just ahead of the curve), a lot of grass eating, and of course,
the final play (thus far) of his coaching career. I could never tell if he was a college football genius or the football equivalent of Homer Simpson living a charmed life despite being overwhelmingly incompetent. The truth was probably somewhere in the middle, but regardless, college football won't be as fun with him not around.


No comments:
Post a Comment