Last week we looked at how ACC teams fared in terms of yards per play. This week, we turn our attention to how the season played out in terms of the Adjusted Pythagorean Record, or APR. For an in-depth look at APR, click here. If you didn’t feel like clicking, here is the Reader’s Digest version. APR looks at how well a team scores and prevents touchdowns. Non-offensive touchdowns, field goals, extra points, and safeties are excluded. The ratio of offensive touchdowns to touchdowns allowed is converted into a winning percentage. Pretty simple actually.
Once again, here are the 2019 ACC standings.
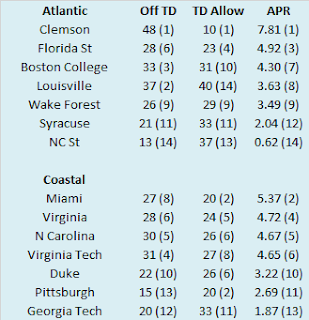
And here are the APR standings with conference rank in offensive touchdowns, touchdowns allowed, and APR in parentheses. This includes conference games only with the championship game excluded.
Finally, ACC teams are sorted by the difference between their actual number of wins and their expected number of wins according to APR.
I use a game and a half as a line of demarcation to determine whether or not a team significantly over or under-performed relative to their APR and by that standard, no team saw their record differ significantly from their APR. Thus we can move on to more important affairs.
Only 90's Kids Will Understand
The ACC has been around since 1953 and in those 67 seasons, no team has done what Clemson has over the past five seasons. The Tigers are on a streak of five consecutive outright conference titles. Of course, framing their accomplishment in this manner does a bit of a disservice to the 90’s version of Florida State. The Seminoles won or shared the conference title for nine consecutive seasons (1992-2000), but since there was no division structure or conference title game, their 1995 (Virginia) and 1998 (Georgia Tech) titles were shared, meaning they never won more than three consecutive outright titles.
With the ACC closely resembling its 90’s self (one dominant team and a host of decent to bad teams), I decided to look and see how the Clemson teams of the past five seasons compared to Florida State’s first five seasons in the ACC (1992-1996). Unfortunately, I don’t have access to individual game box scores, so I am not able to calculate YPP or APR data for those great Florida State teams. Instead, scoring margin in conference play will have to suffice. This analysis will include regular season conference play only, so any non-conference games and the ACC Championship Game for Clemson will not be included. Let’s start by looking at Florida State. Here are the Seminoles ACC scoring margins for their first five seasons.
I was surprised how (relatively) competitive the rest of the ACC was in Florida State’s first season. The Seminoles still outscored their conference opponents by over 20 points per game, but two teams (Clemson and Georgia Tech) played them within a touchdown and another (Virginia) only lost by ten points. I was surprised how dominant the 1993 team (and eventual national champion) was. The Seminoles allowed just 51 points in their eight ACC games, pitching three shutouts, and holding six teams to seven points or fewer while winning by more than 40 points per game. The Seminoles slipped a little in 1994 and remained at about the same level in terms of scoring margin from 1994 through 1996 with the offense picking up the defense’s slack in 1995 and vice-versa in 1996. Now let’s look at the same numbers for Clemson.
The Tigers were somewhat dominant against their conference opponents from 2015 through 2017, but their Death Star was not fully operational until 2018. After beating their ACC foes by fourteen and a half points per game in 2017 (a number the classic Seminole teams would scoff at), Clemson has more than doubled that scoring margin over the past two season. Despite that uptick, Clemson’s scoring margin during their five year ACC title run is about a touchdown less than Florida State’s during their first five seasons in the conference. Clemson would need to maintain their current level of play for another three seasons or so before we could credibly talk about them in the same breath as those 90’s Florida State teams. Before we close this post, I also included Florida State and Clemson’s collective conference record over these five seasons as well as their number of one-score victories.
After winning two one score games in their first season in the conference, Florida State did not play in another one-score conference game until their infamous defeat at Virginia, a span of 24 straight games (or three full conference seasons). By contrast the longest Clemson has gone between one-score conference games is a little more than one season (ten games). As always, thanks for reading. Check back next week when we take a YPP dive through the Big 10.


No comments:
Post a Comment