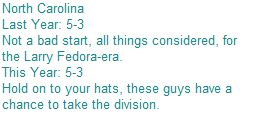
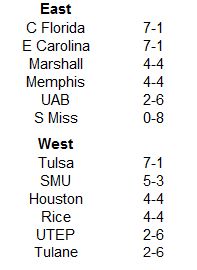
Our second season preview brings us to the newly christened American Athletic Conference. The former Big East will begin play in 2013 with a new name, and some new teams. Who is poised to capture the inaugural crown?
Homefield Advantage for the Pony Express
Back in my Conference USA SDPI recap, I looked at how SMU had performed at home in league play the last four years under June Jones. If you don't want to bother clicking the link, I'll tell you the Mustangs are a sterling 15-1 at home against conference foes since 2009. Their road record, while not terrible, is just 7-9 over that span. For this post, I wanted to take a deeper dive and examine how the Mustangs had performed on a per play basis on both offense and defense, at home and on the road. The table below lists SMU's home splits the past four seasons for their offensive and defensive yards per play.
As you can see, the Mustangs have put up mostly solid, but only one season of extreme yards per play differential at home. Now let's look at the road numbers.
Like most teams, SMU has performed better at home, but the Mustangs have actually been better on a per play basis that their opponents on the road, despite their losing record. One potential reason for this? Total randomness. While SMU has gone a spectacular 15-1 at home over this span, they are an even more unbelievable 7-0 in one-score games, meaning their home mark is at least a tad buoyed by our friend lady luck. Meanwhile, the Mustangs are a more mortal 2-2 on the road in one-score games.
I use many stats. I use many stats. Let me tell you, you have stats that are far worse than the ones that I use. I use many stats.
Friday, July 19, 2013
Sunday, July 14, 2013
2013 ACC Preview
We're still in the dog days of summer, but if you look closely on the horizon, you can see the autumn slowing edging its way here. In a little less than seven weeks, the 2013 college football season will begin. And of course, that means here at Statistically Speaking, its time to start the 2013 College Football Previews. We'll begin with the six BCS conferences and then handicap the races in the four mid-major leagues, before concluding with a look at the Independents. These projections come out of the SDPI ratings published here and a little number I came up with last year called the Adjusted Pythagorean Record. Enjoy!
ACC Newcomers
As you may have heard, two newcomers will join the ACC in 2013. Pitt and Syracuse, like Boston College, Miami, and Virginia Tech a decade before, bolted the Big East and landed in the friendly confines of the ACC. What can we expect from the two newbies in 2013? As you can tell from the previews, my numbers expect them to go a combined 5-11 in the conference. But my numbers are a more micro preview based on how these teams performed last season and pieces they are likely to return (or not return) this season. What if we take a more macro view? In order to try and answer that question, I performed a very unscientific analysis of the 14 teams that make up the 2013 iteration of the ACC. I looked at each team's SRS numbers from the past four seasons. The SRS, or Simple Rating System, attempts to define how many points a team is above or below average. Thus a team with an SRS score of +7.00 should be about a touchdown better than a truly average team on a neutral field. Is this the end all rating for teams? Of course not, but it gives us a ballpark rating of team strength. Using the four seasons of data for each team, I attempted to estimate their SRS score in 2013. To do this I assigned arbitrary percentage values to each SRS score. The further in the past, the lower I weighed the SRS score. The final formula I came up with is described below. This formula is not based on any hard data, but it seemed right to me, and produced plausible results. The 2009 SRS accouts for 15% of the total, 2010 20%, 2011 25%, and 2012 30%. Any astute reader of this blog will notice those percents only add up to 90. For the final 10% I took the average of the four SRS scores. Here is an example of the formula as applied to Boston College. In 2009, the Eagles had an SRS score of 5.47. Multiplied by .15 gives us .82. In 2010, they dropped to 2.15. Multiplied by .2 gives us .43. In 2011, they dipped again to -4.61. Multiplied by .25 gives us -1.15. They continued to drop in 2012 with a score of -6.74. Multiplied by .3 gives us -2.02. Their four year average SRS is -.93. Multiplied by .1 gives us -.09. Adding these five numbers together gives us an estimate of -2.02 for 2013. This number ranks tenth out of 14 teams. Here are how all 14 teams are etimated to rank in 2013.
A few notes. Pitt clearly got the short end of the stick in terms of division allignment. While the Panthers rank seventh in estimated 2013 SRS, they rank just fifth in their division. Meanwhile, Syracuse ranks ninth in estimated SRS, but is a slightly healthier fourth in their division. As I stated earlier, most of these ratings seem plausible. I'll quibbled with Maryland ranking last (that honor should probably belong to Duke), but these numbers seem to pass the eye test.
Atlantic Division
Coastal Division
ACC Newcomers
As you may have heard, two newcomers will join the ACC in 2013. Pitt and Syracuse, like Boston College, Miami, and Virginia Tech a decade before, bolted the Big East and landed in the friendly confines of the ACC. What can we expect from the two newbies in 2013? As you can tell from the previews, my numbers expect them to go a combined 5-11 in the conference. But my numbers are a more micro preview based on how these teams performed last season and pieces they are likely to return (or not return) this season. What if we take a more macro view? In order to try and answer that question, I performed a very unscientific analysis of the 14 teams that make up the 2013 iteration of the ACC. I looked at each team's SRS numbers from the past four seasons. The SRS, or Simple Rating System, attempts to define how many points a team is above or below average. Thus a team with an SRS score of +7.00 should be about a touchdown better than a truly average team on a neutral field. Is this the end all rating for teams? Of course not, but it gives us a ballpark rating of team strength. Using the four seasons of data for each team, I attempted to estimate their SRS score in 2013. To do this I assigned arbitrary percentage values to each SRS score. The further in the past, the lower I weighed the SRS score. The final formula I came up with is described below. This formula is not based on any hard data, but it seemed right to me, and produced plausible results. The 2009 SRS accouts for 15% of the total, 2010 20%, 2011 25%, and 2012 30%. Any astute reader of this blog will notice those percents only add up to 90. For the final 10% I took the average of the four SRS scores. Here is an example of the formula as applied to Boston College. In 2009, the Eagles had an SRS score of 5.47. Multiplied by .15 gives us .82. In 2010, they dropped to 2.15. Multiplied by .2 gives us .43. In 2011, they dipped again to -4.61. Multiplied by .25 gives us -1.15. They continued to drop in 2012 with a score of -6.74. Multiplied by .3 gives us -2.02. Their four year average SRS is -.93. Multiplied by .1 gives us -.09. Adding these five numbers together gives us an estimate of -2.02 for 2013. This number ranks tenth out of 14 teams. Here are how all 14 teams are etimated to rank in 2013.
A few notes. Pitt clearly got the short end of the stick in terms of division allignment. While the Panthers rank seventh in estimated 2013 SRS, they rank just fifth in their division. Meanwhile, Syracuse ranks ninth in estimated SRS, but is a slightly healthier fourth in their division. As I stated earlier, most of these ratings seem plausible. I'll quibbled with Maryland ranking last (that honor should probably belong to Duke), but these numbers seem to pass the eye test.
Tuesday, July 02, 2013
2013 WAC SDPI
Our final SDPI entry of the offseason takes us out west to a conference that will be among the dearly departed in 2013. The WAC enjoyed a fitting sendoff in 2012, featuring two ranked teams, three bowl-eligible teams, and a quartet of teams that won at least eight games. To see last year's post on the WAC, click here.
First here are the 2012 WAC standings.
And here are the 2012 WAC SDPI standings. The standings are sorted by SDPI with ranking for each category (out of seven teams) in parentheses.
Raise your hand if you had Utah State winning their first conference crown since 1997 and finishing ranked for the first time since 1961. Do the same if you had San Jose State winning eleven games for the first time ever and finishing ranked for the first time in school history. The WAC was surprisingly successful in its last season of existence, and its a shame the band can't get back together for one more song.
So Who Was Better Than Their Record Showed?
No school really fits the bill here, and the SDPI ratings line up reasonably well with the actual standings. If forced to make a choice, I suppose the answer is New Mexico State. While the Aggies rated out quite poorly in SDPI, they were actually ahead of Idaho. The Aggies lost the only close game they played (perhaps not coincidentally versus Idaho) and had an almost comical in-conference turnover margin of -18 (in just six games!). That means the Aggies averaged three more tunrovers per game than their conference foes!
So Who Was Worse Than Their Record Showed?
Again, not a whole lot to quibble with here. But if one must choose, take Texas State. The Bobcats were just a smidge better than Idaho and New Mexico State, and did manage to beat both on the field, but teams with an SDPI this low don't usually win a third of their league games.
Conference Superlatives:
Best Offense: Louisiana Tech 1.73
The Bulldogs put on quite a show in 2012, gaining at least 500 yards in every conference games, and put up an absurd 839 yards and 70 points on Idaho in their conference opener.
Worst Offense: Idaho -1.18
The Vandals were held below 400 yards of offense in every conference game save one, and were held below 300 yards twice.
Best Defense: Utah State 1.59
Louisiana Tech and San Jose State were able to move the ball (1100 combined yards), but the Aggies tightened the noose against the weaker foes on the schedule, holding their other four conference opponents to 988 total yards.
Worst Defense: Texas State -0.96
Three league opponents gained over 500 yards against the Bobcats, and only Idaho failed to top 400 yards.
Strong Mid-Majors
The 2012 WAC was quite stong by mid-major standards at the top. Based on the Simple Rating System, a quick and dirty method of ranking teams, three of the seven league members ranked in the top-40. Utah State led the way with an SRS of 10.71 meaning they were about 10.71 points better than a prototypical 'average team'. This number ranked 19th in the nation in 2012. San Jose State was next with a rating of 7.90 which ranked 33rd, and Louisiana Tech was next at 6.33 which ranked 38th. This relative heft prompted me to look at other mid-major leagues to see how often a conference had at least three members rank in the top one-third of the country in SRS. All told, in the BCS era (1998 through the present), nine conferences, including the WAC in 2012 had at least three schools rank in the top third. We'll go through them in chronological order and see that it appears the mid-majors have staged a mini-revolution in terms of producing quality teams.
At the turn of the century, Conference USA was the first mid-major league to produce at least a trio of teams with quality SRS ratings. While Southern Miss actually finished fourth in the conference with a 4-3 mark, they were the top team in SRS thanks to their non-conference performance which included a tight loss to Tennessee and wins over weak BCS-conference opponents Alabama and Oklahoma State (both finished with identical 3-8 records). They also beat a quality mid-major in the bowl game, runing Gary Patterson's debut as head coach of Texas Christian in the Mobile Alabama Bowl. Louisville, the actual conference champion, was just behind Southern Miss in SRS. The Cardinals also beat an SEC team, outlasting in-state rival Kentucky in the season opener. They were also ranked at the end of the regular season, but fell to a strong Colorado State team in the Liberty Bowl. East Carolina rounded out the Conference USA triumverate. Led by quarterback David Garrard, the Pirates finished second in Conference USA, handing Louisville their only league loss and beating Southern Miss for good measure. The Pirates ended their season with a win over Texas Tech from the Big 12 in the Gallery Furniture Bowl.
The mid-majors took an Olympic (or election cycle) sized break after 2000, and did not have a conference finish with a strong trio of teams until 2004. In Dan Hawkins penultimate season as head coach, Boise State went undefeated in the regular season before falling to a Louisville team that had just a single loss in the Liberty Bowl. Fresno State finished third in the WAC, but beat three teams from BCS conferences. They won on the road at Washington and Kansas State in the regular season (those teams finished with just a 5-17 combined record), but did grab a quality scalp with their bowl win over Virginia. In the first year of the Mike Price era, UTEP finished alone in second place in the WAC. The Miners did not grab any impressive wins outside the conference, but they did upset Fresno State and played Colorado tight in the Houston Bowl.
Once again, the mid-majors took some time off before returning to the limelight in 2008. Utah finished unbeaten in 2008 and won three games against BCS-conference opponents. They opened the year by dousing any optimism that Rich Rodriguez would not miss a beat as Michigan coach and followed that up with a midseason win over Oregon State. Their moment in the limelight would come in January in the Sugar Bowl, when they ambushed an Alabama team that had finished the regular season unbeaten. TCU lost twice in 2008, with both games coming on the road. Once to a team that played in the natioal title game (Oklahoma) and then to a team that finished unbeaten (Utah). The Horned Frogs rebounded to knock off an unbeaten Boise State team in the Poinsettia Bowl. BYU lacked the eliteness of their conference mates, but did manage to go 2-1 against Pac-10 foes, beating Washington and UCLA in the regular season before losing to Arizona in the Las Vegas Bowl.
The Mountain West remained strong in 2009. This time it was TCU finishing the regular season unbeaten. The Horned Frogs beat Virginia and Clemson on the road in the regular season, but were upset by Boise State in the Fiesta Bowl. BYU opened the year with a shocking upset of Oklahoma, but were upset at home by a mediocre Florida State team (7-6 record) just two weeks later. Their only loss after that debacle was a drubbing at the hands of TCU. The Cougars capped the year by winning the Las Vegas Bowl over Oregon State. Utah lost to both TCU and BYU, with their only non-conference loss coming at the hands of the eventual Pac-10 champions, the Oregon Ducks. Utah got revenge on the Pac-10 by beating Cal in the Poinsettia Bowl to give the Mountain West three ten-win teams. The Mountain West upped the ante in 2009 by having Air Force join the trio. The Falcons did not grab any marquee scalps until the bowl game when they crushed a ten-win Houston team in the Armed Forces Bowl.
For the third straight year, the Mountain West had three quality teams, and for the second consecutive year, they added a fourth for good measure. TCU once again finished the regular season unbeaten, with wins over BCS-conference foes Oregon State and Baylor. They capped off their dream season with a win over Wisconsin in the Rose Bowl. Utah won their fist eight games and climbed as high as sixth in the country before losses to TCU and Notre Dame crushed their national aspirations. They were then blown out by Boise State in the Las Vegas Bowl to drop them out of the final polls. Once again, Air Force did not have any marquee scalps, but the Falcons did lose by just three at Oklahoma in the regular season and then beat the ACC's Georgia Tech in the Independence Bowl to win nine games for the first time since 2007. San Diego State joined the Horned Frogs, Utes, and Falcons in the top third of college football. On his way to capturing the Michigan job, Brady Hoked led the Aztecs to their first bowl game since 1998. Like the Falcons, the Aztecs didn't have any amazing wins outside the conference, but did lose a tight game to a Big 12 team (Missouri) before winning their bowl game to give them an even (or as it were, odd) nine wins overall.
Joining the Mountain West with three strong teams of their own in 2010 was the WAC. Boise State, Nevada, and Hawaii all finished in a three-way tied with identical 7-1 league records. Boise beat Virginia Tech and Oregon State in the non-conference and won each of their league games by four touchdowns until they were upset in overtime at Nevada. While the loss knocked them out of contention for a BCS bowl, the Broncos took out their frustrations on Utah in the Las Vegas Bowl. Nevada beat Cal in non-conference action and suffered their only loss of the year in a tight game at Hawaii. With a shot at history on the line, the Wolfpack knocked off Boston College in the Fight Hunger Bowl to win thirteen games for the first time in school history. You may have heard of the gentleman they had playing quarterback. Hawaii dropped a relatively close game to Southern Cal to open the 2010 season, and were then blown out by a mediocre Colorado team two weeks later. Their only loss the rest of the way in the regular season was to Boise State. With a shot at eleven wins and a possible finish in the top-25, the Warriors fell apart in the bowl game on their homefield and were crushed by Tulsa on Christmas Eve.
Having seen enough of the Mountain West and WAC, Conference USA returned to prominence in 2011. Houston finished the regular season unbeaten with a home win over UCLA their shining acheivement. However, the Cougars lost at home in the Conference USA Championship Game to Southern Miss that cost them a BCS bid. They rebounded to beat Penn State in the Ticket City Bowl and finished ranked for the first time since 1990. Speaking of Southern Miss, the Eagles beat Virginia from the ACC, but suffered two questionable defeats to league opponents Marshall (7-6 record) and UAB (3-9 record) to miss out on a BCS bid of their own. After upsetting Houston, the Golden Eagles seemed disinterested in their bowl game, but managed to beat Nevada and finish ranked for the first time since 1999. Tulsa endured a brutal non-conference slate, losing to Oklahoma, Oklahoma State, and Boise State, three teams that combined for a 34-5 overall record in 2011. After their loss to Boise, the Golden Hurricane reeled off seven straight wins before succombing to Houston. They then lost a nailbiter in their bowl game against BYU to make them one of the best five-loss teams in the nation.
After a nearly a decade in the doldrums, the MAC broke out somewhat in 2011. Toledo, while they were unable to win their division, played Ohio State and Syracuse tight and suffered an understandable defeat to Boise State in non-conference action. Their other loss came by three to Northern Illinois and ultimately cost them a shot at the MAC title. Temple lost a tight game to Penn State and crushed Maryland in non-conference action. However, the Owls lost to Bowling Green and Ohio in MAC play (not to mention Toledo), so they were also not able to play for the MAC title. Northern Illinois did not acquit themselves well in non-conference play, losing to a bad Kansas team (2-10 record), and getting blow out by Wisconsin. The Huskies also lost their first MAC game (to Westen Michigan) before winning their final seven in the regular season and beating Ohio in the MAC Championship Game.
In the first ten seasons of the BCS era (1998-2007), there were only two instances of mid-major conferences producing a trio of teams that ranked in the top third of college football. In the past five seasons (2008-2012) the mid-majors have accomplished that feat seven times. It does appear that despite the apparent consolidation of power at the very top (seven straight national titles for the SEC), mid-majors are thriving in the upper-middle class of college football.
Tuesday, June 25, 2013
2013 Sun Belt SDPI
Our penultimate conference recap will focus on the Sun Belt, a conference that saw half of its members become bowl eligible last season. To see last year's post on the Sun Belt, click here.
First here are the 2012 Sun Belt standings.
And here are the 2012 Sun Belt SDPI standings. The standings are sorted by SDPI with ranking for each category (out of 10 teams) in parentheses.
Despite breaking in a new coach for the second-consecutive year, Arkansas State repeated as league champs. On the whole, the league sent four teams to postseason play for the first time ever.
So Who Was Better Than Their Record Showed?
Troy finished in the upper-half of the conference on both sides of the ball, but missed out on a bowl game for the second year in a row thanks to a 2-4 record in one-score league games. Overall, the Trojans were just 2-6 in one-score games, losing tight contests to both Mississippi State and Tennessee of the SEC. In addition, six of their seven losses came to teams that qualified for bowl games.
So Who Was Worse Than Their Record Showed?
Middle Tennessee State was below average on both sides of the ball and was actually the lowest rated Sun Belt team by SDPI in 2012. Yet they won three quarters of their conference games thanks to an in-conference best +10 turnover margin and a sterling 4-0 record in one-score games. In fact, over the course of eight Sun Belt games, the Blue Raiders were actually outscored by eight points despite their strong record.
Conference Superlatives:
Best Offense: Louisiana-Lafayette 1.79
In two seasons at the helm, Mark Hudspeth has guided the Cajuns to 18 wins, including a pair of bowl triumphs, and has made them into one of the most explosive mid-major offenses. Lafayette topped 400 yards of offense in six of their eight conference games.
Worst Offense: South Alabama -1.05
In their first season of IA football, the Jaguars (understandably) experienced some major growing pains. The offense was held below 400 yards in six of their eight conference games
Best Defense: Western Kentucky 1.31
After a 5-1 start that included a win over in-state rival Kentucky, the Hilltoppers limped to the finish with just two wins the rest of the season. However, the defense, outside of a ghastly performance against Louisiana-Lafayette, remained stout, holding seven of eight league foes under 400 yards of offense.
Worst Defense: Louisiana-Lafayette -1.75
The Cajuns certainly played an entertaining brand of football in 2012. Half of their league opponents gained over 500 yards against them and the average score of their Sun Belt games 37-28.
Time to Tighten the Ole' Sun Belt
Last post I examined the great success the MAC had in their non-conference clashes with teams from BCS conferences in 2012. This week, I want to do the same with the Sun Belt. In 2012, Sun Belt teams won three games versus teams from BCS conferences. That number equals the three they notched in 2007 as the most the league has won in its history. In addition, the winning percentage against BCS conferences was the best in league history. The table below lists the aggregate winning percentage of the Sun Belt against BCS conference opponents for each season since 2005.
The Sun Belt will be posting a net loss of two members in 2013, as Florida Atlantic, Florida International, Middle Tennessee, and North Texas move up to Conference USA and Georgia State (from IAA) and Texas State (from the WAC) join the league. However, the conference's stronger teams, Arkansas State, the Louisiana schools, Troy, and Western Kentucky remain in tow and could add additional BCS conference wins to the Sun Belt's ledger.
Saturday, June 15, 2013
2013 MAC SDPI
Just three more conferences to go. This week we head to the nation's heartland where we examine the 2012 MAC season. Here's a link to last year's MAC post.
First here are the 2012 MAC standings.
And here are the 2012 MAC SDPI standings. The standings are sorted by division by total SDPI with ranking for each category (out of 13 teams) in parentheses.
If you enjoyed lame puns, you could call 2012 'The Return of the MAC'. The league sent an amazing seven teams to bowl games, had four teams visit the AP top 25, and had its first BCS bowl participant.
So Who Was Better Than Their Record Showed?
The Western Michigan Broncos lost three conference games by less than a touchdown and committed 22 turnovers leading to an in-conference worst -12 turnover margin. These factors prevented the Broncos from being one of the league's Magnificent Seven bowl teams despite solid peripherals. That got the head coach fired despite four winning campaigns and three bowl appearances in eight seasons.
So Who Was Worse Than Their Record Showed?
Kent State played in their first bowl game since being captained by The Dawgfather in 1972. The Golden Flashes were perfect in conference play (until the MAC Championship Game), but they only ranked sixth in SDPI. The Golden Flashes won the two close conference games they played, had a +9 in-conference turnover margin, and scored five non-offensive touchdowns to power their special season.
Conference Superlatives:
Best Offense: Northern Illinois 1.67
Jordan Lynch did a fine Chandler Harnish impression, throwing for over 3000 yards and adding over 1800 on the ground. The team gained over 400 yards in each conference game, and twice topped the 600 yard mark.
Worst Offense: Massachusetts -1.71
The Minutemen began their first season in the MAC by gaining nearly 1000 yards in their first two games, but averaged just 252 yards per game in their final six.
Best Defense: Bowling Green 2.55
The Falcons boasted one of the stouter mid-major defenses in the country, and perhaps the best the MAC has ever seen. The Falcons held three league foes under 200 yards of offense, and five under 300.
Worst Defense: Eastern Michigan -1.17
Unlike the Falcons, the Eagles were a sieve on defense, holding just one conference opponent under 400 yards of offense.
Rising Up
In 2012, MAC teams won eight games against teams from BCS conferences. Some of the wins were not all that impressive (league champ Northern Illinois held off a bad Kansas team by just a touchdown at home), but when looking at how the league had performed against big-boy conference foes in the past few seasons, the record was impressive nonetheless.
After winning just nine such games in three season, the MAC nearly equaled that total in 2012, and their winning percentage against BCS conference teams was nearly triple what it had been the previous three seasons.
Monday, June 03, 2013
2013 Mountain West SDPI
The next installment in our 2012 lookback takes us to the Mountain West Conference. The league said goodbye to a traditional power TCU, but welcomed in three teams from the WAC (Fresno State, Hawaii, and Nevada). In 2013, the league will welcome two more WAC schools (San Jose State and Utah State) and play a conference championship game. Here is a link to last year's Mountain West post.
First here are the 2012 Mountain West standings.
And here are the 2012 Mountain West SDPI standings. The standings are sorted by total SDPI with ranking for each category (out of 10 teams) in parentheses.
We had a three-way tie at the top of the heap with a rock/paper/scissors situation as Boise beat Fresno, who beat San Diego State, who beat Boise.
So Who Was Better Than Their Record Showed?
Nevada was statistically the third best team in the conference, but only managed a .500 mark in league play. The Wolfpack were not extermely unlucky either, posting a 3-2 mark in one-score conference games. We'll just have to chalk this one up to the vagaries of an eight-game conference season and a very poor defense.
So Who Was Worse Than Their Record Showed?
This one is pretty easy to answer. San Diego State enjoyed a solid season, ranking fifth in the conference in SDPI. However, teams of their ilk usually do not lose just once in conference play. The Aztecs won both of their close conference games, using a two-point conversion to stun Nevada in overtime, and a kickoff return touchdown to upset Boise on the Smurf Turf.
Conference Superlatives:
Best Offense: Fresno State 1.62
These guys were fun to watch (until the bowl game of course). Quarterback Derek Carr threw 37 touchdown passes and now has more in his Fresno career than big brother David. Running back Robbie Rouse had nearly 1500 yards on the ground and matriculates as the school's all-time leading rusher. Freshman receiver Davante Adams hauled in over 100 passes and caught 14 touchdowns.
Worst Offense: Hawaii -1.71
Norm Chow continues to tarnish his reputation as an offensive guru by leading teams like this. The Warriors failed to top 400 yards of offense in any conference game.
Best Defense: Boise State 1.83
Despite a host of attrition, the Broncos boasted the best defense in the league. At one point, they held five consecutive league foes below 300 yards of offense.
Worst Defense: Wyoming -1.38
The Cowboys surrendered yards in bunches, allowing half their league foes to gain at least 500 yards of offense.
Where is the Hawaii Homefield Advantage
Last post, I examined the strong homefield advantage June Jones has built at SMU. This week I want to look at what he left behind on the islands. Jones coached the Warriors for nine seasons (1999-2007), and during that time, his teams went a stellar 28-9 against league foes at home and in his final six seasons, that mark was 21-3. Since Jones left following the 2007 season, the Warriors have still won more than they have lost in their exotic locale. but their home record against league foes is a more pedestrian 11-8. See the table below for the full rundown.
Friday, May 31, 2013
2013 Conference USA SDPI
Having finished our sojourn through the BCS conferences, we now turn our attention to the little guys. We'll begin with Conference USA. Here is the link to last year's Conference USA post.
First here are the 2012 Conference USA standings.
And here are the 2012 Conference USA SDPI standings. The standings are sorted by division by total SDPI with ranking for each category (out of 12 teams) in parentheses.
Don Williams would have been proud because for the first time 2005, the champion of Conference USA was living on Tulsa time. The Golden Hurricane served to bookend this era of Conference USA football, winning the first ever Conference USA Championship Game in 2005, and winning the last of this current iteration of Conference USA football. The league will look a little different in 2013, as Central Florida, Houston, Memphis, and SMU head to the Big East (or American Athletic Conference) and Florida Atlantic, Florida International, Louisiana Tech, Middle Tennessee State, North Texas, and Texas-San Antonio join the league, giving it a robust fourteen members.
So Who Was Better Than Their Record Showed?
Marshall moved the ball with ruthless efficiency against their league brethren, but had a difficult time stopping opponents, and their resulting games, while entertaining, ended in defeat too often for a postseason invite. A 2-4 record in one-score games, as well as a non-conference schedule that featured three bowl teams also conspired to keep the Thundering Herd home for the holidays.
So Who Was Worse Than Their Record Showed?
There wasn't a great deal of disconnect between the actual standings and the SDPI ratings, but Rice is probably the answer here. The Owls were wholly unimpressive on both sides of the ball and three of their four league wins came against Southern Miss, Tulane, and UTEP, a trio than combined for a 4-20 league record.
Conference Superlatives:
Best Offense: Marshall 1.88
The Herd gained over 600 yards in three league games and topped the 500-yard barrier five times.
Worst Offense: Memphis -1.47
The Tigers appeared to get things together as the season wore on. In their first four league games during which they went just 1-3, Memphis averaged 272 yards per game. In their final four league games during which they went 3-1, Memphis averaged 382 yards per game.
Best Defense: Memphis 1.56
Like the offense, the defense improved in the second half of conference play. The Tigers allowed 357 yards per game through their first four, but just 306 per game over their last four games.
Worst Defense: Tulane -1.65
The defense was bad, very bad, but at least things got better. In their first conference games, the Green Wave allowed 651 yards to Tulsa. They would not allow that many yards to another team all season.
Honolulu East
June Jones has done an admirable job since taking the reigns of the Pony Express at SMU prior to the 2008 season. His charges have played in four consecutive bowl games, after missing out on the postseason for nearly a quarter century, have finished with a winning league record for four straight years, and even won their division in 2010. Not only that, but the Mustangs will be putting on their big boy pants (sort of) and moving on to the American Athletic Conference in 2013. But perhaps the most impressive thing June Jones has done at SMU has been to craft a distinct homefield advantage. Over the past four season, SMU has lost just a single time to a league foe at home. In that same span, they have gone just 7-9 on the road in conference play.
That compares quite favorable to the homefield advantage enjoyed by Hawaii during Jones' final four seasons on the islands.
SMU may not win the former Big East conference, but their home conference opponents, who all play on the east coast (Rutgers, Temple, Connecticut, and Central Florida), had better beware.
Tuesday, May 28, 2013
2013 SEC SDPI
I promised the 2012 reviews would start coming Fast and Furious. This marks the final BCS conference review as we finally examine the SEC. Here is the link to last year's SEC post.
First here are the 2012 SEC standings.
And here are the 2012 SEC SDPI standings. The standings are sorted by division by total SDPI with ranking for each category (out of 14 teams) in parentheses.
The 2012 SEC marked the first time any BCS conference featured 14 teams. And while there was a great deal of heft at the top of the league, there were also some serious millstones at the bottom. Both Auburn and Kentucky went winless in the conference. For Auburn, it marked their first winless league campaign since 1952! As a point of reference, both Georgia Tech and Tulane were in the SEC back then. For Kentucky. one does have to go back quite as far.
So Who Was Better Than Their Record Showed?
You knew the Arkansas Razorbacks were in for a rough year after a tumultuous offseason that saw their coach fired in disgrace, a psychopath hired in his place, and an early loss to Louisiana-Monroe. However, the Hogs were not quite as bad as their record showed. Tight losses to Ole Miss and LSU and an in-conference worse turnover margin of -13 ensured Arkansas would miss out on a bowl for the first time since 2008.
So Who Was Worse Than Their Record Showed?
LSU continues to defy the odds under Les Miles. Despite another season of middling peripherals, the Tigers won 75% of their league games and were 5-2 in one-score conference games. Under Miles, the Tigers are an amazing 25-11 in one-score conference games. Call him clutch, call him lucky, call him insane, but the man gets things done in tight spots.
Conference Superlatives:
Best Offense: Texas A&M 2.23
The league newcomer lead by eventual Heisman winner Johnny Manziel, absolutely shredded SEC defenses. After being held to 334 yards in their conference opener, the Aggies averaged an incredible 577 yards over their last seven league contests and topped 600 yards four times.
Worst Offense: Auburn -1.76
Texas A&M's lowest offensive output in the conference (334 yards against Florida) would have represented about 100 yards more than Auburn's average SEC output.
Best Defense: Alabama 1.78
LSU, Texas A&M, and then Georgia in the SEC Championship Game proved the defense was not impenetrable, but it sure seemed that way through their first five league games where the Tide held opponents to just 204 yards per game and allowed just four offensive touchdowns.
Worst Defense: Tennessee -1.79
The Volunteer offense was pretty good (ranking fourth in a strong league), but the defense was an absolute turnstile. Every conference opponent, even a woeful Kentucky squad, topped 400 yards against the Vols.
Winning the Les Miles Way
Some might say this is lazy, but I just feel I wrote a great article a few months ago. Head on over to College Football by the Numbers to check out a little something I wrote about Les Miles and the spread. You won't be disappointed.
http://www.cfbtn.com/2013/03/win-but-dont-cover-football-les-miles.html#.UaD1AJzefao
Sunday, May 26, 2013
2013 Pac-12 SDPI
Sorry for the hiatus, but we're back with our offseason SDPI previews. I promise the next seven will go a lot faster than the first four. In this installment we tackle the Pac-12, a league that has sent two teams (and the same two teams I might add) to the BCS in each of the past three seasons. Here, as always, is a link to last year's Pac-12 post.
First here are the 2012 Pac-12 standings.
And here are the 2012 Pac-12 SDPI standings. The standings are sorted by division by total SDPI with ranking for each category (out of 12 teams) in parentheses.
For the first time since 1999, the Stanford Cardinal won the Pac-12. Though they ranked a notch below the powerful Oregon Ducks, Stanford shut Oregon down in their head-to-head matchup (just their second win in the series since 2001) and won the division title and the opportunity to win the overall crown in the Pac-12 Championship Game. In other minutiae news, UCLA became the first school to play in the Pac-12 Championship Game more than once.
So Who Was Better Than Their Record Showed?
Despite their disappointing season, the Trojans from Southern Cal actually played at a relatively high level. The Trojans were above-average on both sides of the ball, but were 0-2 in one-score games, lost to three teams that finished the season ranked in the top-seven, and didn't show up for their bowl game in El Paso. Certainly, they were a major disappointment after beginning the season ranked number one, but they were far from your ordinary 7-6 also-ran.
So Who Was Worse Than Their Record Showed?
No one in the Pac-12 significantly outperformed their peripherals, but UCLA rated out below both Arizona State and Southern Cal in their division, despite winning the crown. The Bruins can thank a 3-1 record in one-score (regular season) conference games, including an exciting 45-43 victory over Arizona State that ultimately decided the division championship.
Conference Superlatives:
Best Offense: Oregon 1.80
The Ducks rolled up over 400 yards of offense in all nine of their league games and topped the 40-point barrier in each game save their loss to Stanford.
Worst Offense: Colorado -1.49
The Buffs opened conference play by gaining 531 yards in a win against Washington State. They averaged just 279 yards per game the rest of the way and did not win again.
Best Defense: Stanford 1.51
Arizona and Oregon gouged them (by their lofty standards at least) totaling over 1000 yards against the Cardinal defense. However, the other seven Pac-12 foes could only muster an average of 274 yards per game against Stanford, making those seven teams the equivalent of Colorado when they faced the nerds from Palo Alto.
Worst Defense: Arizona -1.98
It took a lot to be worse than Colorado at anything in 2012, but Arizona was up to the challenge. Four conference opponents gained over 600 yards against the porous Wildcat defense, and only one team failed to top 400 yards of offense.
What to Make of Arizona State?
The 2012 Sun Devils are a hard team to figure out. On the one hand, they ranked 3rd in SDPI, behind Oregon and Stanford. On the other hand, each of their five conference victories came against the bottom five teams in SDPI. However, their wins were usually convincing, as only one was by a single score, and they came by an average of 24 points per game. But when the Sun Devils stepped up in competition, they were more South Park Satan than powerful Prince of Darkness. In their four league losses, against teams ranked first (Oregon), fourth (Southern Cal), fifth (Oregon State), and seventh (UCLA), only one was close (the two-point loss to UCLA). The other three came by an average of nearly 18 points per game. Perhaps Dennis Green said it best, 'they are who we thought they were'. The Sun Devils were equivalent to a seventh grade bully in 2012, towering over the other kids on the playground with inhalers or who had yet to enter puberty, but not in the same class as the high school kids they long to emulate.
Subscribe to:
Posts (Atom)