Thursday, March 02, 2023

2022 Adjusted Pythagorean Record: Big 12

Last week we looked at how Big 12 teams fared in terms of yards per play. his week, we turn our attention to how the season played out in terms of the Adjusted Pythagorean Record, or APR. For an in-depth look at APR, click hereIf you didn’t feel like clicking, here is the Reader’s Digest version. APR looks at how well a team scores and prevents touchdowns. Non-offensive touchdowns, field goals, extra points, and safeties are excluded. The ratio of offensive touchdowns to touchdowns allowed is converted into a winning percentage. Pretty simple actually.

Once again, here are the 2022 Big 12 standings.
And here are the APR standings with conference rank in offensive touchdowns, touchdowns allowed, and APR in parentheses. This includes conference games only with the championship game excluded.
Finally, Big 12 teams are sorted by the difference between their actual number of wins and their expected number of wins according to APR.
TCU and Oklahoma State significantly exceeded their APR while Iowa State significantly underachieved. TCU and Iowa State also over and underachieved respectively based on their YPP numbers and we went over some reasons for that last week. Oklahoma State actually played well for the first half of conference play. Through four games, the Cowboys were 3-1 in the league with their lone loss coming in overtime to TCU. However, they staggered home like a criminally over-served tavern patron, losing four of their last five with three of losses coming by at least two touchdowns and their lone victory coming by six points. 

Going Streaking
Brent Venables, regarded as one of the best defensive coordinators in college football, was expected to continue the lineage of elite teams at Oklahoma. The Sooners were the preseason favorite in the Big 12 and were ranked ninth in the preseason AP Poll. Oklahoma opened the season winning their three non-conference games by a combined 97 points culminating with a beatdown of former Big 8 rival Nebraska. Another Big 12 title and a potential CFP bid seemed on the horizon. Then the Sooners dropped their conference opener to Kansas State, lost their starting quarterback to injury against TCU, and without him suffered their worst defeat in Red River history. The Sooners stemmed the tide somewhat midseason, beating both Kansas and Iowa State, but lost three of four down the stretch to finish the regular season 6-6. But more importantly, at least for our purposes, they finished with a losing conference record for the first time since 1998. 

John Blake, a former Oklahoma defensive lineman under Barry Switzer, coached the Sooners for three seasons (1996-1998), neatly coinciding with the beginning of the Big 12. His tenure exacerbated the malaise that began under Gary Gibbs in the late 80's and continued with the forgettable single season of Howard Schnellenberger. The Sooners finished with losing records in each of Blake's three seasons and never finished better than 3-5 in Big 12 play. Venables arrived as an assistant on Bob Stoop's first staff in 1999 and the Sooners did not finish with a losing conference record until Venables returned as head coach in 2022. 

1998 serves as good inflection point in the history of college football. It was not the beginning of the modern era, but it did represent a more regimented segregation between the haves (BCS and later Power Five conferences) and the have-nots (non-BCS and Group of Five conferences). It was also the (theoretical) end of split national titles. So in the spirit of that inflection point, and in honor of Oklahoma's long run, which power conference teams in the BCS and CFP eras have endured the fewest losing conference records? Read on to find out. 
Like Oklahoma, Clemson also finished with a losing conference record in 1998 and fired the responsible party. Despite a losing overall record in 2011, they have not finished with a losing conference record since. Joining Clemson at the top and edging out Ohio State and Oklahoma is Georgia which finished 3-5 in SEC play in 2010, but has not had a losing league record in any other season of the BCS/CFP era. Cincinnati has an asterisk as they were only in a BCS conference for nine seasons (2005-2013). 

What about the other side of the coin? Which power conference teams have posted the most losing conference records? I bet you could guess most of them.
2007 and 2008. Those were the only seasons in the BCS/CFP era when Kansas did not finish with a losing conference record. The other teams that populate this list are a who's who of basement dwellers for the past quarter century. However, I must admit, I am a little shocked at Arizona's place on this list. Even Rich Rodriguez could only manage two winning Pac-12 records over his six seasons in Tucson.

Before we close, lets look at the most consecutive seasons without a losing conference record.
Clemson's streak is still active and baring an unforeseen set of circumstances, the Tigers should see their streak reach a quarter century in 2023.

And finally, the most consecutive seasons with a losing conference record.
Kansas is just a few years away from matching Indiana's streak of futility. Can the Jayhawks end the skid in 2023? Stay tuned to find out. 

Thursday, February 23, 2023

2022 Yards Per Play: Big 12

This week we head to another Big conference that managed to produce both a surprise champion and a surprise playoff participant

Here are the 2022 Big 12 standings. 
So we know what each team achieved, but how did they perform? To answer that, here are the Yards Per Play (YPP), Yards Per Play Allowed (YPA) and Net Yards Per Play (Net) numbers for each Big 12 team. This includes conference play only, with the championship game not included. The teams are sorted by Net YPP with conference rank in parentheses.
College football teams play either eight or nine conference games. Consequently, their record in such a small sample may not be indicative of their quality of play. A few fortuitous bounces here or there can be the difference between another ho-hum campaign or a special season. Randomness and other factors outside of our perception play a role in determining the standings. It would be fantastic if college football teams played 100 or even 1000 games. Then we could have a better idea about which teams were really the best. Alas, players would miss too much class time, their bodies would be battered beyond recognition, and I would never leave the couch. As it is, we have to make do with the handful of games teams do play. In those games, we can learn a lot from a team’s YPP. Since 2005, I have collected YPP data for every conference. I use conference games only because teams play such divergent non-conference schedules and the teams within a conference tend to be of similar quality. By running a regression analysis between a team’s Net YPP (the difference between their Yards Per Play and Yards Per Play Allowed) and their conference winning percentage, we can see if Net YPP is a decent predictor of a team’s record. Spoiler alert. It is. For the statistically inclined, the correlation coefficient between a team’s Net YPP in conference play and their conference record is around .66. Since Net YPP is a solid predictor of a team’s conference record, we can use it to identify which teams had a significant disparity between their conference record as predicted by Net YPP and their actual conference record. I used a difference of .200 between predicted and actual winning percentage as the threshold for ‘significant’. Why .200? It is a little arbitrary, but .200 corresponds to a difference of 1.6 games over an eight game conference schedule and 1.8 games over a nine game one. Over or under-performing by more than a game and a half in a small sample seems significant to me. In the 2022 season, which teams in the Big 12 met this threshold? Here are Big 12 teams sorted by performance over what would be expected from their Net YPP numbers.
TCU and Texas Tech significantly exceeded their expected record based on YPP while Kansas and Iowa State underachieved. TCU and Texas Tech combined to finish 7-0 in one-score Big 12 games, buoying their respective league records. TCU also had the best in-conference turnover margin in Big 12 play (+7) and while Texas Tech was insanely aggressive under first year head coach Joey McGuire (lead nation in fourth down attempts), they managed to convert an unsustainable percentage of their fourth downs (64%). Iowa State finished 0-6 in one-score Big 12 games and also had the worst in-conference turnover margin (-10). Kansas was not unfortunate in close Big 12 games (1-1 record), but their defense could not get off the field in high-leverage situations, allowing Big 12 opponents to covert nearly 73% of their fourth down attempts. 

Closing the Deal
TCU became the first Big 12 team other than Oklahoma to make the College Football Playoff in 2022. They became the first Big 12 team to play for a national championship since Texas in 2009. And they were also the first ever Big 12 team to win a College Football Playoff Game. Tremendous accolades all. However, I derive pleasure from pointing out failure. And did you know that TCU did not even win the Big 12 in 2022? In fact, they joined a longer than expected list of BCS/Power Five teams to finish unbeaten in conference play and lose their conference title game. 
2022 marked the third consecutive year this phenomenon occurred. Despite the setbacks, the three legitimate contenders were still selected by the CFP Committee (Southern Cal was 13th in the penultimate CFP rankings in 2020 and were unlikely to qualify had they beaten Oregon in the Pac-12 Championship Game). 

The list of non-BCS/Group of Five teams to lose their conference title game after rolling through league play with an unblemished record is not much shorter. 
This trend has also happened at the Group of Five level each of the past three seasons, including thrice in the Covid year of 2020. 

We had a little fun at TCU's expense in this post, but I want to congratulate the Horned Frogs on a great season. For my money, the 2014 team was better and just as deserving of a CFP bid. Plus, I would have loved to have seen what the 2009 or 2010 teams could have done in a system that did not exclude non-BCS conference schools. 

Thursday, February 16, 2023

2022 Adjusted Pythagorean Record: Big 10

Last week we looked at how Big 10 teams fared in terms of yards per play. his week, we turn our attention to how the season played out in terms of the Adjusted Pythagorean Record, or APR. For an in-depth look at APR, click hereIf you didn’t feel like clicking, here is the Reader’s Digest version. APR looks at how well a team scores and prevents touchdowns. Non-offensive touchdowns, field goals, extra points, and safeties are excluded. The ratio of offensive touchdowns to touchdowns allowed is converted into a winning percentage. Pretty simple actually.

Once again, here are the 2022 Big 10 standings.
And here are the APR standings with conference rank in offensive touchdowns, touchdowns allowed, and APR in parentheses. This includes conference games only with the championship game excluded.
Finally, Big 10 teams are sorted by the difference between their actual number of wins and their expected number of wins according to APR.
Purdue significantly exceeded their APR while their division mates Illinois and Minnesota underachieved. Purdue also overachieved relative to their YPP numbers and we went over some reasons for that last week. Illinois was probably the best team in the Big 10 West, but they finished 1-4 in one-score conference games. If Illinois was not the best team in the Big 10 West, Minnesota may have been. The Gophers actually had a winning record in one-score conference games (2-1), but they were absurdly dominant in their other three league wins (won by a combined 86 points) which boosted their APR. 

Purdue's Historical Season
Purdue became the ninth Big 10 team to play in the conference's title game in 2022 (Illinois, Indiana, Maryland, Minnesota, and Rutgers are the five still waiting for their first appearance) and in the process became just the fourth BCS/Power Five conference title game participant to allow more touchdowns than they scored in league play. 
Purdue was unable to join Virginia Tech and actually capture their conference's crown despite allowing more touchdowns than they scored. 

We try not to give short shrift to the Group of Five around these parts, so I would be remiss if I left out the non-BCS/Group of Five teams that qualified for their conference's championship game despite allowing more touchdowns than they scored. 
It's a small sample, but the Group of Five teams that allowed more touchdowns than they scored actually won two of three league title games. 

How did the other six teams that accomplished this feat before Purdue perform the next season? It's a mixed bag, but a few of the teams enjoyed continue success.
East Carolina and Bowling Green actually won Conference USA and the MAC the following season while UCLA once again qualified for the Pac-12 Championship Game. Northern Illinois and Tennessee fell on hard times, but Purdue fans can take solace their team is not doomed to tumble in the Big 10 standings next season. 

Thursday, February 09, 2023

2022 Yards Per Play: Big 10

Two conferences down, eight to go. We head to the midwest this week and examine the Big 10, home of two playoff participants (and zero playoff wins) in 2022. 

Here are the 2022 Big 10 standings. 
So we know what each team achieved, but how did they perform? To answer that, here are the Yards Per Play (YPP), Yards Per Play Allowed (YPA) and Net Yards Per Play (Net) numbers for each Big 10 team. This includes conference play only, with the championship game not included. The teams are sorted by division by Net YPP with conference rank in parentheses.
College football teams play either eight or nine conference games. Consequently, their record in such a small sample may not be indicative of their quality of play. A few fortuitous bounces here or there can be the difference between another ho-hum campaign or a special season. Randomness and other factors outside of our perception play a role in determining the standings. It would be fantastic if college football teams played 100 or even 1000 games. Then we could have a better idea about which teams were really the best. Alas, players would miss too much class time, their bodies would be battered beyond recognition, and I would never leave the couch. As it is, we have to make do with the handful of games teams do play. In those games, we can learn a lot from a team’s YPP. Since 2005, I have collected YPP data for every conference. I use conference games only because teams play such divergent non-conference schedules and the teams within a conference tend to be of similar quality. By running a regression analysis between a team’s Net YPP (the difference between their Yards Per Play and Yards Per Play Allowed) and their conference winning percentage, we can see if Net YPP is a decent predictor of a team’s record. Spoiler alert. It is. For the statistically inclined, the correlation coefficient between a team’s Net YPP in conference play and their conference record is around .66. Since Net YPP is a solid predictor of a team’s conference record, we can use it to identify which teams had a significant disparity between their conference record as predicted by Net YPP and their actual conference record. I used a difference of .200 between predicted and actual winning percentage as the threshold for ‘significant’. Why .200? It is a little arbitrary, but .200 corresponds to a difference of 1.6 games over an eight game conference schedule and 1.8 games over a nine game one. Over or under-performing by more than a game and a half in a small sample seems significant to me. In the 2022 season, which teams in the Big 10 met this threshold? Here are Big 10 teams sorted by performance over what would be expected from their Net YPP numbers.
Purdue and Michigan were the only Big 10 teams that saw their expected record differ significantly from their actual record. Both the Boilermakers and Wolverines overachieved and whaddaya know, they also happened to play in the Big 10 Championship Game. Michigan was a somewhat fortunate 2-0 on one-score Big 10 games while Purdue was 4-1 in such contests. 

Picture It, Ireland, 2022
Nebraska and Northwestern played one of the first college football games of the 2022 season in Ireland. The Cornhuskers and Wildcats were looking to rebound from disappointing 2021 campaigns. Both schools finished at the bottom of the Big 10 West with identical 1-8 conference records. Northwestern was legitimately bad, but Nebraska was better than their record by almost any statistical measure. The opener was big for both teams. For Northwestern, it was an opportunity for the Wildcats to prove the Covid-delayed 2020 season was not a fluke. The Wildcats finished 6-1 in Big 10 play that season, qualified for the Big 10 Championship Game, and finished tenth in the final AP Poll (their first top ten finish since the historic 1995 season). However, sandwiched around that division title were identical 1-8 Big 10 records in 2019 and 2021. For Nebraska, 2022 was Scott Frost's last chance to succeed at his alma mater. Frost was hired after leading UCF to an undefeated record and dubious national title claim in 2017. However, in his first four seasons in Lincoln, the Cornhuskers lost nearly twice as many games (29) as they won (15). Frost made some staff changes heading into 2022, most notably tabbing Mark Whipple to be his offensive coordinator. The Cornhuskers also bid adieu to enigmatic quarterback Adrian Martinez and replaced him with Texas transfer Casey Thompson. There was a little preseason buzz for Nebraska and the Cornhuskers entered the game against the Wildcats as a double digit favorite. Nebraska built a double digit lead in the third quarter, but faltered in yet another close game, losing 31-28. And Frost, much like Fleishman, was in trouble. But I didn't come here to write any additional epitaphs on Scott Frost's tenure at Nebraska. I want to talk about the team that won the game in Ireland.

After Northwestern upset Nebraska, most Wildcat fans probably thought they were in store for a nice rebound season. After a bye, Northwestern's next three games were all at home against Duke (under a first year coach with low expectations), Southern Illinois (FCS), and Miami of Ohio. A road trip to Penn State immediately followed that homestand and Ohio State was on the schedule in November, but theoretically, Northwestern should have banked enough wins to be in contention for a bowl bid at the end of the season. That was not the case. Northwestern dropped all three of those winnable home games and then proceeded to lose all eight of their remaining conference games. In doing so, they joined a somewhat exclusive club, becoming just the fifteenth BCS/Power Five conference team since 2005 to win their conference opener and lose the rest of their conference games. 
The club gets even more exclusive when considering the fact that Northwestern pulled an upset in their conference opener. Only eight other teams pulled an upset in their conference opener and lost out in league play. 
Like the other eight teams on this list, Northwestern did not fool the betting market. The Wildcats were double digit underdogs in their final eight conference games. 

Thursday, February 02, 2023

2022 Adjusted Pythagorean Record: ACC

Happy Candlemas to all who celebrate!

Last week we looked at how ACC teams fared in terms of yards per play. his week, we turn our attention to how the season played out in terms of the Adjusted Pythagorean Record, or APR. For an in-depth look at APR, click hereIf you didn’t feel like clicking, here is the Reader’s Digest version. APR looks at how well a team scores and prevents touchdowns. Non-offensive touchdowns, field goals, extra points, and safeties are excluded. The ratio of offensive touchdowns to touchdowns allowed is converted into a winning percentage. Pretty simple actually.

Once again, here are the 2022 ACC standings. 
And here are the APR standings with conference rank in offensive touchdowns, touchdowns allowed, and APR in parentheses. This includes conference games only with the championship game excluded. Also, note Virginia and Virginia Tech's rankings are on a per game basis since they only played seven conference games due to a real world tragedy
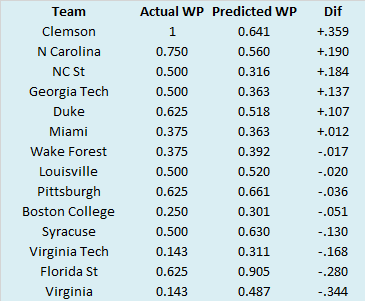
Finally, ACC teams are sorted by the difference between their actual number of wins and their expected number of wins according to APR.
Georgia Tech (more on them later), Miami, and NC State significantly exceeded their expected APR while Wake Forest, Florida State, and Virginia underachieved. Georgia Tech, Miami, and NC State combined to finish 9-3 in one-score conference games. In addition, those three teams suffered ten double digit conference losses. If they weren't winning close, they were usually getting blown out. Meanwhile, Wake Forest, Florida State, and Virginia were a combined 2-8 in one-score conference games. Virginia was not able to get margin in any of their conference victories, but Wake Forest and Florida State combined to win seven ACC games by ten points or more. The Demon Deacons also finished with the worst in-conference turnover margin (-10) in the ACC which torpedoed their goal of repeating as division champs

Did Georgia Tech Improve?
The Geoff Collins era mercifully came to an end in late September after an ugly loss to UCF dropped the Yellow Jackets to 1-3. Under interim coach Brent Key, the team rallied, winning four of their final eight games to finish 5-7, their best record since Paul Johnson retired. Key's performance earned him the full time gig, and he appears to have the Yellow Jackets trending in the right direction. To illustrate this point, let's look at Georgia Tech's conference record under both men.
Under Key, Georgia Tech finished with a winning conference record, while they barely won more than a fourth of their games under Collins. At a minimum, Key should have the Yellow Jackets back in bowl contention over the next few seasons. But, just to be thorough, let's look under the hood. Here is how the Yellow Jackets fared in terms of Yards Per Play in ACC play under both men.
This has to be a misprint. The Yellow Jackets somehow put up a worse YPP Net under Key? Indeed they did. Their defensive improvement was more than offset by an offensive decline. What about my other favorite metric, APR? 
The Yellow Jackets scored and allowed touchdowns in ACC play at about the same ratio under Brent Key as they did under Geoff Collins. Under Collins, the Yellow Jackets won about one fewer conference game than we would expect based on the ratio of their touchdowns scored and allowed. Over 26 games they won seven league games instead of eight. Meanwhile, despite allowing more touchdowns than they scored under Key, the Yellow Jackets won four of the seven conference games he coached. 

How did Georgia Tech pull this off? While the Yellow Jackets did not fare any better under Key than they did under Collins in per play efficiency or scoring and allowing touchdowns, they were markedly improved in the oft ignored area of football: special teams.
The kicking game was a mess under Collins. In three plus seasons, Georgia Tech kickers made less than half their field goals. For comparisons sake, the median team field goal percentage in college football is about 75%. Key turned the kicking responsibilities over to Gavin Stewart after being named interim coach and he converted twelve of his thirteen kicks. Key also apparently allowed his special teams to practice kick and punt protection as the team did not allow any blocked kicks under his watch after allowing 16 under Collins, including four in their first four games of 2022. Did the team even practice special teams under Collins? Probably. That would seem like a pretty big oversight if they didn't, but based on their play, I can't definitively say they did. 

Another area where Georgia Tech improved under Key was turnover margin. 
In 26 ACC games under Collins, the Yellow Jackets finished in the red in the turnover department 14 times. They were 2-12 in those games. In games where they did not lose the turnover margin, Georgia Tech was a respectable 5-7. Under Key, the Yellow Jackets lost the turnover battle once. In the six games where they were even or in the black, they finished 4-2. 

So what do we make of the Brent Key hire? Key's promotion certainly saved the 2022 season (as much as a 5-7 record can qualify as 'saving'). Had the team not fired Collins, its quite possible Georgia Tech would have finished 0-8 or 1-7 in the ACC. The team played hard under Key and although they did not play better on a per play basis, the special teams improved dramatically and the turnover margin reversed course. We should probably give Key credit for identifying the best kicker on the team and for shoring up punt and field goal protection, but turnovers are notoriously fickle. It is highly unlikely that Georgia Tech averages a +1 margin in each conference game going forward under Key. I would like to have seen a bigger swing when it came time to name the full time head coach. I want to stress I am not a journalist or Georgia Tech insider, so I don't know who was a realistic candidate when the school was searching for a head coach. Key is an alum who obviously wanted the job, but an unsustainable turnover margin and a 4-1 record in one-score games made Georgia Tech look better than they were. I wish Key the best, but I think the Yellow Jackets will be in the market for a new head coach by the time the 2025 season kicks off (if not before). 

Thursday, January 26, 2023

2022 Yards Per Play: ACC

Next up in our conference breakdowns is the ACC. 

Here are the 2022 ACC standings.
So we know what each team achieved, but how did they perform? To answer that, here are the Yards Per Play (YPP), Yards Per Play Allowed (YPA) and Net Yards Per Play (Net) numbers for each ACC team. This includes conference play only, with the championship game not included. The teams are sorted by division by Net YPP with conference rank in parentheses
College football teams play either eight or nine conference games. Consequently, their record in such a small sample may not be indicative of their quality of play. A few fortuitous bounces here or there can be the difference between another ho-hum campaign or a special season. Randomness and other factors outside of our perception play a role in determining the standings. It would be fantastic if college football teams played 100 or even 1000 games. Then we could have a better idea about which teams were really the best. Alas, players would miss too much class time, their bodies would be battered beyond recognition, and I would never leave the couch. As it is, we have to make do with the handful of games teams do play. In those games, we can learn a lot from a team’s YPP. Since 2005, I have collected YPP data for every conference. I use conference games only because teams play such divergent non-conference schedules and the teams within a conference tend to be of similar quality. By running a regression analysis between a team’s Net YPP (the difference between their Yards Per Play and Yards Per Play Allowed) and their conference winning percentage, we can see if Net YPP is a decent predictor of a team’s record. Spoiler alert. It is. For the statistically inclined, the correlation coefficient between a team’s Net YPP in conference play and their conference record is around .66. Since Net YPP is a solid predictor of a team’s conference record, we can use it to identify which teams had a significant disparity between their conference record as predicted by Net YPP and their actual conference record. I used a difference of .200 between predicted and actual winning percentage as the threshold for ‘significant’. Why .200? It is a little arbitrary, but .200 corresponds to a difference of 1.6 games over an eight game conference schedule and 1.8 games over a nine game one. Over or under-performing by more than a game and a half in a small sample seems significant to me. In the 2022 season, which teams in the ACC met this threshold? Here are ACC teams sorted by performance over what would be expected from their Net YPP numbers.
Clemson significantly exceeded their expected record (more on them later) while Florida State and Virginia underachieved relative to their YPP numbers. Clemson won all their one-score ACC games, finishing 3-0 in such contests. Each close victory also came against division opponents, giving them a leg up in the conference race. Florida State was not terrible in one-score conference games, finishing 1-2. However, they were absurdly dominant in most of their conference wins. Four of their five ACC victories came by at least 25 points. Mike Norvell should have found a way to save some of those excess points for later. Virginia was 1-3 in close conference games and also finished with the second worst in-conference turnover margin (-6) making life rough for first year head coach Tony Elliott

Worst Unbeaten Power Five Teams
For all the talk of their demise, Clemson did win the ACC for the seventh time in eight seasons in 2022. They also finished unbeaten in ACC play for the first time since 2019. However, you didn't have to squint too hard to see this team's warts. While their defense was one of the best in the ACC, their offense was below average in league play. And their non-conference performance left a lot to be desired. Notre Dame whipped them in South Bend, South Carolina beat them for the first time since 2013, and Tennessee (sans their starting quarterback) handled them in the Orange Bowl. Their unbeaten ACC record probably says a lot more about the state of the conference in 2022 than it does bout their own prowess. In fact, as far as unbeaten Power Five teams go, Clemson was historically bad (or more accurately, mediocre) in 2022. 

As I often mention, I have been tracking YPP data back to 2005. In those 18 seasons, only six Power Five (formerly BCS) teams have finished unbeaten in conference play with a YPP Net of less than 1.00. Those six teams are listed in the following table sorted by YPP Net. 
There are technically six teams that qualified for this table, but Southern Cal should have a big ole asterisk. I know college football seasons can run together, but remember the 2020 season was played in the midst of a global pandemic. The Pac-12 initially decided not to play football, but eventually played an abbreviated campaign beginning in November. The Trojans won all five of their regular season games, including several in improbable fashion, all while barely outgaining their opponents on a per play basis. Had the Pac-12 played a standard schedule, its unlikely the Trojans could have continued their improbable run, but they did win all their scheduled regular season conference games. The Pac-12 Championship Game was a different story, but remember, I don't include championship games in the YPP stats. Anyway, whether or not we include Southern Cal in this analysis, its clear Clemson enjoyed an historic season in 2022. The Tigers became just the fourth team to finish unbeaten in conference play, finish with a YPP Net of less than 1.00, and win their conference championship game (Southern Cal and Iowa dropped their respective title games). I don't know if all of that will fit on a t-shirt, but Clemson fans can always check Tee Public to see. 

Before we close, I think it is helpful to see how those five previous teams performed the following season. Finishing unbeaten in conference play often requires at least a small amount of good fortune and with a YPP Net of less than 1.00, it probably required some additional good bounces. It would stand to reason then, that these teams would see some regression the following season. And that is exactly what we see (teams in the table are listed chronologically). 
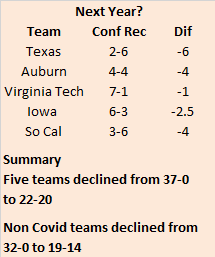
If we include Southern Cal, this quintet declined from perfection to mediocrity. If we ignore Southern Cal, the decline is still significant, though not nearly as steep. However, the main thing to remember here is sample size. Five (or four) teams is hardly a representative sample. I'd bet against Clemson finishing with a perfect ACC record next year, but I don't think they are in store for a Tommy West style season. Despite his lofty hateability rating, Dabo is at least partially self-aware when it comes to football matters. He fired his offensive coordinator and replaced him with the OC from the national runner up. Clemson may not be as fortunate as they were this past season, but they will probably be better, much to the haters' (myself included) chagrin. 

Thursday, January 19, 2023

2022 Adjusted Pythagorean Record: AAC

Last week we looked at how AAC teams fared in terms of yards per play. his week, we turn our attention to how the season played out in terms of the Adjusted Pythagorean Record, or APR. For an in-depth look at APR, click hereIf you didn’t feel like clicking, here is the Reader’s Digest version. APR looks at how well a team scores and prevents touchdowns. Non-offensive touchdowns, field goals, extra points, and safeties are excluded. The ratio of offensive touchdowns to touchdowns allowed is converted into a winning percentage. Pretty simple actually. 

Once again, here are the 2022 AAC standings.
And here are the APR standings with conference rank in offensive touchdowns, touchdowns allowed, and APR in parentheses. This includes conference games only with the championship game excluded.
Finally, AAC teams are sorted by the difference between their actual number of wins and their expected number of wins according to APR.
Cincinnati won two more games than we would have expected based on the number of touchdowns they scored and allowed in league play. The Bearcats were involved in a lot of close games, and while their 3-2 record in such AAC contests was not extraordinary, they failed to dominate their conference foes as they had in the past. Three of their six conference victories came by at least ten points, but none by more than twenty. In 2020 and 2021, Cincinnati won eleven conference games by at least nineteen points. Meanwhile Memphis and South Florida won significantly fewer games based on their respective touchdowns scored and allowed. Memphis and South Florida also underachieved relative to their YPP numbers and we went into some reasons for that last. 

The End of an Era
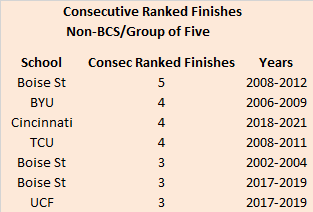
Between Cincinnati's loss to Tulane in their regular season finale and their rivalry renewal with Louisville in Fenway Park, Luke Fickell accepted the Wisconsin job. The Fickell era at Cincinnati was an unquestioned success. In Fickell's six seasons, the Bearcats won two conference titles, appeared in three league championship games, and became the first Group of Five team to qualify for the College Football Playoff. Each an impressive accomplishment. However, if the Bearcats had been able to beat Tulane or knock off Louisville in their bowl, they would have added one final feather to Fickell's cap. Had the Bearcats finished ranked in the final AP Poll, they would would have tied Boise State for the most consecutive ranked finishes among non-BCS/Group of Five teams in the BCS and Playoff eras.
Since 1998, five mid-major schools have finished ranked for at least three consecutive season (Boise State, BYU, Cincinnati, TCU, and UCF). Once the 2023 college football season kicks off, only one will remain in the mid-major ranks, as BYU, Cincinnati, and UCF are set to join TCU in the Big 12. Three mid-major schools finished ranked in 2022 (Tulane, Troy, and Fresno State), but neither finished ranked in 2021, so Boise's run from 2008-2012 will remain the gold standard until at least the latter part of this decade. 

Thursday, January 12, 2023

2022 Yards Per Play: AAC

The 2022 season is over. As always, the college football season feels like it will never arrive, and then when it does, it ends in a flash. To help you navigate the dark and depressing offseason, we'll be reviewing the 2022 season for each FBS conference through the lens of Yards Per Play and the Adjusted Pythagorean Record. We go alphabetically, so Sun Belt fans, check back around Memorial Day. 

Here are the 2022 AAC standings. 
So we know what each team achieved, but how did they perform? To answer that, here are the Yards Per Play (YPP), Yards Per Play Allowed (YPA) and Net Yards Per Play (Net) numbers for each AAC team. This includes conference play only, with the championship game not included. The teams are sorted by Net YPP with conference rank in parentheses.
College football teams play either eight or nine conference games. Consequently, their record in such a small sample may not be indicative of their quality of play. A few fortuitous bounces here or there can be the difference between another ho-hum campaign or a special season. Randomness and other factors outside of our perception play a role in determining the standings. It would be fantastic if college football teams played 100 or even 1000 games. Then we could have a better idea about which teams were really the best. Alas, players would miss too much class time, their bodies would be battered beyond recognition, and I would never leave the couch. As it is, we have to make do with the handful of games teams do play. In those games, we can learn a lot from a team’s YPP. Since 2005, I have collected YPP data for every conference. I use conference games only because teams play such divergent non-conference schedules and the teams within a conference tend to be of similar quality. By running a regression analysis between a team’s Net YPP (the difference between their Yards Per Play and Yards Per Play Allowed) and their conference winning percentage, we can see if Net YPP is a decent predictor of a team’s record. Spoiler alert. It is. For the statistically inclined, the correlation coefficient between a team’s Net YPP in conference play and their conference record is around .66. Since Net YPP is a solid predictor of a team’s conference record, we can use it to identify which teams had a significant disparity between their conference record as predicted by Net YPP and their actual conference record. I used a difference of .200 between predicted and actual winning percentage as the threshold for ‘significant’. Why .200? It is a little arbitrary, but .200 corresponds to a difference of 1.6 games over an eight game conference schedule and 1.8 games over a nine game one. Over or under-performing by more than a game and a half in a small sample seems significant to me. In the 2022 season, which teams in the AAC met this threshold? Here are AAC teams sorted by performance over what would be expected from their Net YPP numbers.
Navy and Tulane exceeded their expected record while Memphis, Temple, and South Florida underachieved relative to their per play performance. For Navy, being an overachiever is par for the course (more on that in a bit). The Midshipmen and Green Wave combined to go 5-2 in one-score conference games, buoying their record. Tulane also had the best in-conference turnover margin at +9. Meanwhile, Memphis, Temple, and South Florida combined to finish an amazing 0-10 in one-score conference games. Memphis finished a perfect 0-4 in such games while Temple and South Florida were each 0-3. 

Protect the Motherland
After the annual Army/Navy game, the United States Naval Academy rather unceremoniously fired longtime head coach Ken Niumatalolo. The firing may have been deserved. Navy has finished with a losing record in four of the past five seasons, but the timing and location were not a good look. But I'm not here to give Chet Gladchuk advice on handling his HR duties. Although, if he is a reader of this blog I do hereby offer my consulting services. No, I'm here to point out how great Ken Niumatalolo was at getting the most out of his Navy teams. Navy exceeded their expected record based on YPP the most of any AAC team in 2022. As I mentioned earlier, that was not unusual for the Midshipmen. Navy has been an AAC member since 2015 and in those eight seasons, they have consistently exceeded the meager expectations set by their YPP numbers. 
In those eight seasons, Navy has exceeded their expected record based on YPP by .179 points of winning percentage on average. A few paragraphs up, you'll note that I consider any one season deviation of .200 or greater significant. Over eight seasons under the same head coach, Navy nearly averaged a significant over-performance. In the long run, we would expect most teams to finish close to zero in terms of difference from their expected record. Outlier seasons in one direction tend to be evened out by more neutral seasons or outliers in the other direction. However, it appears Niumatalolo possessed some kind of secret sauce to get his teams to overachieve (it was probably the triple option). For comparison's sake, four other teams managed a positive differential between their actual record and their expected record based on YPP. If we combine those four teams average differential (.142), it would still be less than Navy's. 

Before we move on, a few things regarding the table. Connecticut has an asterisk because they left the AAC after the 2019 season. And the last column in the table is simply a way to contextualize the average difference in winning percentage. The number .179 may not intuitively seem large, in the context of an eight game conference schedule, it means nearly an extra game and a half in the standings. 

Not only was Navy better than the sum of their parts under Niumatalolo, they also sprung quite a few upsets. In fact, they pulled off the most upsets in AAC play since joining the conference in 2015.
What's that you say? This table is devoid of context. Perhaps Navy pulled so many upsets because they were an underdog more often than everyone else. You make a great point. Context is important.
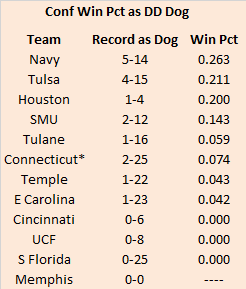
Not only did the Midshipmen pull the most upsets as a conference underdog, they also had the second best winning percentage as an underdog in conference games. 

Navy pulled the most upsets, and they also pulled the most big upsets.
Navy won five conference games as an underdog of ten points or more, with four of the five victories coming over the past two seasons. And once again, it wasn't a function of them playing the most game as a double digit underdog. 
The Midshipmen also had the best winning percentage of any AAC team as a double digit underdog. Also, props to Memphis for avoiding being a double digit conference underdog for the past eight seasons. 

Niumatalolo was replaced as head coach by defensive  coordinator Brian Newberry. Newberry has been the defensive coordinator for the past four seasons (three of which were losing campaigns I might add). Will the Midshipmen continue to overachieve (at least relative to YPP) under Newberry or did Niumatalolo have some Bill Snyder magic that is impossible to replicate? We'll find out over the next few years. Or maybe we won't. 

Monday, January 09, 2023

Strangers in the Field Part VII: How'd We Do?

The college football season is almost over the the NFL regular season is done. Let's take a look back and see how the predictions from our Vegas trip went. 

Games of the Year
Things were not looking great after the first few weeks of the season, but our luck improved as the season continued. 

College Football Win Totals
Time to brag a little here. The record is actually 15-5, but the San Jose State bet was refunded since they had a game canceled. 

NFL Bets
Move along. Nothing to see here. Might be time to consider not making season long plays on the NFL. Most of these missed by a wide margin (Cincinnati and Philadelphia were really good) and I was extremely lucky the Panthers fired Matt Rhule and were able to cash that ticket. 

Miscellaneous
I blame the Mets for this catastrophe. They choked in late September and conceded the division to the Braves. 

Money Wagered: $2020
Money Won: $2462.35
ROI: 21.90%

Not a bad trip if I do say so myself. Hopefully we can keep picking winners on this year's trip.