Saturday, August 04, 2007

Introducing...The Pythagenmelt Rankings

The goal of every statistical analysis in sports is to find out how 'good' a team really is. Many formulas exist to rank teams, and now I am throwing my hat into that ring. I would like to reveal to you what I like to call the Pythagenmelt rankings. While it may sound like some sort of grease fest you are likely to be served at Carl's Jr., it is actually a college football power ranking system. It is basically, the Pythagorean Theorem with schedule strength adjustments (and a few other minor adjustments). It is displayed like a team's winning percentage. For example, a team with a Pythagenmelt rating of .500 is an average team. This season, beginning with the first week in October (after most teams have played 4 or 5 games), I will be posting the Pythagenmelt rankings of the current season here at Statistically Speaking on a bi-weekly basis. However, as a little off season exercise, I calculated the Pythagenmelt rankings for all 119 teams from last season (before the bowls) to get a good idea of how the ratings would work. I am pretty satisfied with the results. Below you will find the rankings for every team by conference, with a national rank in parentheses. A short commentary will follow each conference, listing some observations I found while doing the rankings. I invite you to join the discussion in the comments section with feedback and/or suggestions. One final note, the rankings only include games against Division IA foes. All games against other competition are excluded.


No real surprises here in the ACC. I don't think most people believe that Wake Forest and Georgia Tech were the best teams in the ACC last season.


The one team that jumps out here is the Cincinnati Bearcats. Consider this: Of their five losses last season, four came to Ohio State (Pythagenmelt #1), Louisville (#4), Virginia Tech (#6), and West Virginia (#8) all on the road. While their head coach, Mark Dantonio, made what may end up being a lateral move to Michigan State, they nabbed one of the best lesser-known big time coaches in Brian Kelly from Central Michigan. Fresh off a MAC Championship in his third year at Central Michigan, Kelly, like Bobby Petrino at Louisville is a great hire to take this program to the next level. He also won two national titles at Division II Grand Valley State. This year they drop the Buckeyes and Hokies from the non-conference slate and get both Louisville and West Virginia at home. I'm not saying they will win the Big East, but keep your eye on them.


Remember,these are pre-bowl rankings, so the debacle in the desert is not included for Ohio State. Minnesota was much better than their record indicated in Glen Mason's final season. Methinks the Gopher faithful will find out how good of a coach Mason was very soon.


Could Texas Tech fall to fifth place in the Big 12 South in 2007? Performance-wise, they were already there in 2006.


Despite the loss to UCLA, the Trojans still finished #3 overall. The reason? They dominated Arkansas (#15), Cal (#17), Notre Dame (#20), Nebraska (#25), and Oregon (#38).


The best conference by far in 2006. Seven teams finished in the top 30, and the worst team in the conference finished #79. I was surprised by the Vols high ranking. The SEC East will be a bear in 2007, with Georgia, Florida, South Carolina, and Tennessee all harboring realistic hopes of taking the crown. Don't be surprised if Phil Fulmer is in Atlanta in early December for the second time in four seasons.


Notre Dame was pretty good. Army and Temple were very bad. Navy was solid. Groundbreaking stuff.


At the top the Mountain West was a BCS-caliber league. Elsewhere...Not so much. BYU is actually the highest rated mid-major from last season. And that's before their dominating bowl win over a solid Oregon team.


In you were wondering how Boise could be ranked behind BYU, a fellow mid-major with two losses, have a look at all the teams below Nevada. Three WAC schools finished 109th or worse, and only a third of the league had a Pythagenmelt winning percentage greater than .500.


Not a lot to say here. The best team won the league and gave a pretty good SEC team all they could handle in the bowl.


Not a banner year for the MAC as only Central Michigan finishes with a winning Pythagenmelt winning percentage.


Once again the weakest of all the conferences. Louisiana-Monroe had some hard luck last season. Five of their 8 losses were by a combined 15 points, including a pair of two-point losses to Kansas (#52) and Kentucky (#54).

Saturday, July 28, 2007

First Annual Predictomatic Contest


Amazingly, this blog has just recently celebrated it's two-year anniversary. In the two years I've been blogging, this space has evolved from a general sports blog, to a college football blog. As I strive to make this blog more informative and analytical, I decided I also need to make it a little more fun. Thus, get eggcited for the introduction of what I hope to be an annual contest...The Predictomatic.

The rules are simple. For each of the 6 BCS conferences (ACC, Big East, Big 10, Big 12, Pac 10, and SEC) select the team you think will win that league. But the fun doesn't stop there. Next select the teams you think will finish in the basement of each league. For leagues with two divisions (ACC, Big 12, and SEC), select the teams to that will win each division, finish in the cellar in each division, and the team that will win the corporately sponsored championship game. Next, select a team from outside the BCS that you think will play in a BCS bowl game this season. If you don't think one will qualify this season, make 'no team' your selection. Finally, choose your national champion and the total points scored in the BCS Championship Game.

Each correct selection of a conference champion, last place conference team, non-BCS BCS bowl game participant, and national champion will be worth 10 points. Each division champion, last place division team, and a correct 'no team' selection in the non-BCS category will be worth 5 points. To summarize, you ballot should have 23 selections broken down in this manner:

ACC (5)
2 Division winners (5 points each)
2 Last place teams (5 points each)
1 Champion (10 points)

Big East (2)
1 Champion (10 points)
1 Last place team (10 points)

Big 12 (5)
2 Division winners (5 points each)
2 Last place teams (5 points each)
1 Champion (10 points)

Big 10 (2)
1 Champion (10 points)
1 Last place team (10 points)

Pac 10 (2)
1 Champion (10 points)
1 Last place team (10 points)

SEC (5)
2 Division winners (5 points each)
2 Last place teams (5 points each)
1 Champion (10 points)

Non-BCS BCS Bowl Game Participant
1 Team (10 points) or No Team (5 points)

National Champion (10 points)

Tiebreaker
Total points in BCS Championship Game

The ballot with the most points (170 total possible) will win. If the national title is spilt (2003), then both selections will be valid, but only the total points in the BCS Championship Game will count in the tiebreaker. Please send your completed ballots to predictomatic@yahoo.com by August 24, 2007 with your name and/or alias in the body of the email.

What will the victor receive? This is where you come in. You may have noticed at the top of this blog there are advertisements. I am paid from these ads on a per click basis. Starting 9/1/07 and continuing through 12/31/07, every cent that is earned from clicks will be given to the winner. Please click the ads occasionally, but do not click them an inordinate number of times as they could be revoked leaving the winner with no cash prize. A conservative estimate for the winning haul would be somewhere between $25-35. The winner will be paid via check (if I know you personally) or money order around mid-February 2008. Consider it a Valentines day present from me. In October, November, and December I'll be posting updates, not only of the conference races, but also of the 'jackpot' that is being accumulated by the eventual winner. Please enjoy what I hope is to become an annual tradition.

Saturday, July 21, 2007

The Best Quarterback in College Football


Who was the best college quarterback in 2006? Troy Smith won the Hesiman, Walter Camp, and Davey O'Brien awards. Brady Quinn won the Maxwell Award. Colt Brennan was the highest rated passer. Chris Leak's team won the national title. Jared Zabransky's team finished undefeated. Who was the best?

College football has many different types of quarterbacks. Some 'manage' the game well, others are fortunate to play in run n' shoot offenses that boost their passing numbers, and others are athletic and run the option. Determining which quarterback is the 'best' in any given year is nigh impossible. But that doesn't mean its not worth a shot. The method that I am going to employ to rank quarterbacks is quarterback rating adjusted for opponent. Quarterback rating is not nearly a perfect measure of how well a quarterback performed (it does not include rushing yards and touchdowns or fumbles and in my opinion puts too high a premium on completion percentage), but it is a pretty good indicator. The methodology for adjusting for opponents is explained at the end of this post. Enjoy.

Let's start by ranking the top 25 quarterbacks from 2006 based on their unadjusted quarterback rating.

Colt Brennan 186.0
John Beck 169.1
JaMarcus Russell 167.0
Tyler Palko 163.2
Kevin Kolb 162.7
Jared Zabransky 162.6
Troy Smith 161.9
Colt McCoy 161.8
Brian Brohm 159.1
Justin Willis 158.4
Adam Trafralis 155.1
Chase Holbrook 155.1
Andre Woodson 154.5
Erik Ainge 151.9
Jordan Palmer 149.6
Bobby Reid 148.1
Nate Davis 147.3
Brady Quinn 146.7
Dan LeFevour 146.2
Zac Taylor 146.1
Graham Harrell 145.8
Chase Daniel 145.1
Chris Leak 144.9
John David Booty 144.0
John Stocco 143.9

Now here are the top 25 quarterbacks based on the adjusted quarterback rating. The second number indicates how much the actual rating improved or declined while the third number indicates how much the overall ranking changed. For quarterbacks who climb or fall a significant amount, an explanation is included.

John Beck 175.3 +6.2 +1
TCU (#7 in pass efficiency defense) and Wyoming (#12) in conference play as well as Boston College (#19) and Oregon (#28) outside Mountain West play help Beck take the top spot.

Colt Brennan 175.0 -11 -1
5 WAC teams finished with pass efficiency defenses rated 101st or higher (Idaho, Fresno State, New Mexico State, Louisiana Tech-2nd to last, and Utah State-last). Warriors also played UNLV (#113) in the non-conference schedule.

JaMarcus Russell 167.7 +0.7 E

Brian Brohm 166.3 +7.2 +5
Several good pass defenses on the schedule: Rutgers (#8), South Florida (#11), Cincinnati (#20), Miami (#24), and Wake Forest (#26).

Andre Woodson 165.3 +10.8 +8
Faced three pass defenses in the top 10 (LSU, Florida, and Georgia).

Troy Smith 162.1 +0.2 -1

Tyler Palko 160.5 -2.7 -3

Colt McCoy 160.0 -1.8 E

Kevin Kolb 157.9 -4.8 -4
3 Conference USA opponents finished over 100 nationally in pass efficiency defense (Tulane, Rice, and Memphis) and one was knocking at the door--UCF (#98).

Chris Leak 156.2 +11.3 +13
See Andre Woodson comment and add Ohio State (#10) and Arkansas (#18), Florida State (#29), and Auburn (#33).

Jared Zabransky 155.3 -7.3 -5
See Colt Brennan comment.

Erik Ainge 153.3 +1.4 +2

Riley Skinner 151.7 +12.1 +20
The first quarterback from outside the top 25 to jump onto the list, Skinner was a big part of Wake's dream season. Faced Virginia Tech (#2), Georgia Tech (#9), Clemson (#17), Boston College (#19), Louisville (#23), and Florida State (#29).

Brady Quinn 151.7 +5.1 +4

Bobby Reid 151.6 +3.5 +1

John David Booty 151.3 +7.3 +8
No truly great pass defenses on the schedule (Arkansas-#18 and Michigan-#25 the best), but besides Notre Dame (#90) no awful pass defenses either.

Chad Henne 151.3 +7.9 +9
Henne faced the top-ranked pass efficiency defense (Wisconsin) and the number ten rated defense (Ohio State) to go along with Penn State (#14) and Southern Cal (#22).

Adam Trafralis 150.4 -4.7 -7
See Colt Brennan and Jared Zabransky comment on the weakness of the WAC.

Bryan Cupito 148.8 +8.0 +11
Faced Wisconsin (#1), Kent State (#5 and a bit overrated), Ohio State (#10), Penn State (#14), and Michigan (#25). Also poor game against North Dakota State (67.5 QB rating) gets thrown out because they are not Division IA. Only rating i really don't agree with.

John Stocco 146.0 +2.1 +5

Dan LeFevour 145.6 -0.6 -2

Justin Willis 145.4 -13 -12
See Kevin Kolb comment, but replace Memphis (#116) and UCF (#98) with UAB (#103) and Marshall (#93). Also had an outstanding game against Sam Houston State (291.2 QB rating) that is thrown out.

Brandon Cox 145.3 +6.6 +12
See assorted SEC comments.

Nate Davis 145.3 -2.0 -7

Matt Moore 144.3 +4.6 +7

There you have it. It's a scientific fact that John Beck was the best quarterback in 2006. Maybe not quite that ex cathedra a proclamation, but he certainly is in the discussion. Five quarterbacks: Chase Holbrook (once again weak pass defenses in the WAC), Jordan Palmer (once again weak pass defenses in Conference USA) and three Big 12 quarterbacks (Zac Taylor, Graham Harrell, and Chase Daniel) fall out of the top 25.

Methodology:

1) Exclude all games against non-Division IA competition
2) For each game take the player's QB rating and divide by the QB rating defense (pass efficiency defense) of the opponent faced
3) Multiply this ratio by the number of pass attempts for the game
4) Add the these numbers up for each game
5) Divide by total pass attempts on the season
6) Multiply this number by 127.53 (the cumulative arithmetic mean quarterback rating for all passes thrown in 2006)
7) Voila

Saturday, July 14, 2007

The Teams You Beat


The impetus for this blog comes from some astute posting over at Kermit the Blog in regards to the relative paucity in quality opposition in Big East scheduling. The question I want to address here is whether a weak schedule can help us predict what will happen the following season. Is a team that beat up on patsies more likely to decline the following season than a team that played and won against a tough schedule? To answer this question, I performed two sets of regression analyses.

First I looked at the wins of all 65 BCS teams (plus Notre Dame) in 2005 and took the record against BCS teams (plus Notre Dame) of teams they had beaten (wins against non-Division IA teams excluded). Confused? Here's an example. In 2005, the Pittsburgh Panthers finished 5-6 under first year coach Dave Wannstedt. Their five wins were against Youngstown State, Cincinnati, South Florida, Syracuse, and Connecticut. The Youngstown State game gets thrown out since we are only concerned with games against Division IA teams. The first team they beat, Cincinnati, was 2-6 against other BCS teams (beating only Connecticut and Syracuse), South Florida was 4-5, Syracuse was 0-10, and Connecticut was 2-6. Combined, the teams Pitt beat finished 8-27 against BCS teams for a rather low winning percentage of .229. This number is our dependent variable and we will see how well it predicts the next season's (2006) winning percentage and conference winning percentage for each BCS team.

r squared value for predicting next season's winning percentage: .0946

r squared value for predicting next season's conference winning percentage: .0901

Both relationships are positive indicating that as defeated opponent's record against BCS teams goes up, so does both conference and overall winning percentage. Defeated opponent's combined record against BCS teams appears to be a consistent, albeit poor predictor of team's finish the following season. The r squared value is practically identical for both record and conference record the next season, but only a little more than 9% of the variation is explained.

While compiling each team's defeated opponent's record against BCS teams I noticed that winning percentage against BCS teams can have sample size issues. Therefore, I also decided to use total wins against BCS teams by defeated opponents as an independent variable. An example from 2005 between two Pac 10 schools can illustrate the dramatic effect sample size can have. In 2005, the Oregon Ducks had a fantastic regular season finishing 10-1. Their 10 wins were against Houston (1-1 versus BCS schools), Montana (non-Division IA), Fresno State (0-2), Stanford (4-5), Arizona State (5-5), Washington (1-8), Arizona (2-7), Cal (5-4), Washington State (1-7), and Oregon State (3-6). Combined, their defeated opponents finished 22-45 against BCS schools for a winning percentage of .328. That same season the Arizona Wildcats finished a disappointing 3-8. Their wins were against Northern Arizona (non-Division IA), Oregon State (3-6), and UCLA (7-2). Combined, their defeated opponents finished 10-8 for a winning percentage of .556. That's nearly 23 percentage points higher than Oregon's defeated opponents. However, their defeated opponents have less than half as many wins as Oregon's. Here are the r squared values for total wins.

r squared value for predicting next season's winning percentage: .2456

r squared value for predicting next season's conference winning percentage: .2183

Both relationships are positive indicating that as defeated opponent's total wins against BCS teams goes up, so does both conference and overall winning percentage. Again both relationships appear to be relatively consistent in regards to both conference and overall winning percentage. However, the predictive ability for total wins is over twice as high as winning percentage.

What does this all mean? While it certainly does matter to some extent how 'good' a team's wins were when predicting how they will fare the following season, it is certainly not the best indicator for future success. Instead of using it to predict how good a team will be, its best used to quantify how good a team was.

Thursday, July 05, 2007

Building a Better Mousetrap: Adjusted Pythagorean Winning Percentage


Time and again I've espoused on this blog the virtues of using a team's Pythagorean winning percentage to project more accurately how they will perform in the upcoming season. For the uninitiated the formula for the Pythagorean winning percentage is as follows:

Points Scored^2.37)/(Points Scored^2.37 + Points Allowed ^2.37)

The resulting number is a team's Pythagorean winning percentage. Multiplying that number by the number of games played will give a reasonable estimation of how many games a team should have won. However, the the formula is not without its flaws. For starters, blowouts, especially extreme blowouts can artificially inflate or deflate a team's Pythagorean record depending on whether or not they received or doled out the beating. The solution? Compute the Pythagorean winning percentage on a game by game basis, add up the totals, and divide by games played. This way each game is counted the same and the effect of blowouts is lessened. Here is a hypothetical example of the adjusted theorem in action for Eponymous State University.

ESU Results

17-10
31-28
21-35
70-3
34-20
21-24
28-14
21-17
34-14
21-27
14-6

ESU went 8-3 while scoring 312 points and allowing 198. Their Pythagorean winning percentage is .746. Their expected record is then 8.21-2.89. Their actual record is aligned pretty well with their Pythagorean record. However, one game sticks out like a sore thumb and is unjustly influencing the ratings. In the fourth game ESU dropped 70 on their opponent. Perhaps they were a Division III school, maybe they were a Division I school with a slew of injuries, maybe they turned the ball over nine times, maybe ESU ran up the score. Either way, we need to find a way to lessen that game's impact. Say for example, ESU stopped scoring after 30 points. They still win the game rather easily, but their seasonal Pythagorean winning percentage drops to .680 (7.48-3.52). That's almost 3/4 of a decrease in expected wins. If we determine the Pythagorean winning percentage of each game, add them up, and divide by 11 we get an adjusted Pythagorean winning percentage of .669 (7.36-3.64).

When we compute the Pythagorean winning percentage on a per game basis the difference between beating a team 30-3 and 70-3 is only about 3/100 of a point in winning percentage.

(30^2.37)/(30^2.37+3^2.37)=.996

(70^2.37)/(70^2.37+3^2.37)=.999

70 points is just piling on. Each extra score above a certain point negligibly increases the odds of winning the ball game. This in effect puts the proverbial 'cap' on margin of victory.

Now the important part. Is the adjusted Pythagorean winning percentage a decent predictor of a team's fortunes. Here are the r squared values for how three 2005 statistics predicted a teams 2006 winning percentage (BCS schools and Notre dame only--sample size 66).

2005 winning percentage: .352
2005 Pythagorean winning percentage: .3653
2005 adjusted winning percentage: .39

All three measures were reasonable predictors with adjusted Pythagorean winning percentage being the best predictor. It should be noted that in a post last off season, click here to view it, we found a team's (again BCS schools and Notre dame only) 2004 Pythagorean winning percentage to be a much better predictor than its 2004 winning percentage of its 2005 winning percentage. Part of the reason for the lowered predictive powers for both measures could be the added 12th game in 2006. The majority of the time the 12th game features a BCS school taking on a low-level Division IA or non-Division IA school for a guaranteed victory, thus boosting a team's winning percentage.

Saturday, June 23, 2007

Historical SDPI: 1995 Aspiring National Champions


This is the first in a series of quasi-weekly pieces leading up to the beginning of the college football season where I analyze the SDPI of the two teams that played for the mythical national title in the days before the BCS (plus other contenders if there was controversy). Don't know what SDPI is? Click here for an answer. We'll begin with the 1995 season. The de facto national title game was played in the Fiesta Bowl between Nebraska and Florida. Come take a trip with me back to a simpler time; when games could end in ties, when Tom Osborne was patrolling the sidelines in Lincoln, and the Ol' Ball Coach was turning a weak-armed, balding quarterback into a Heisman Trophy candidate.

1995 Big 8 Summary

Standings

Nebraska 7-0
Colorado 5-2
Kansas 5-2
Kansas State 5-2
Oklahoma 2-5
Oklahoma State 2-5
Iowa State 1-6
Missouri 1-6

SDPI Standings

Nebraska 3.54
Kansas State 1.57
Colorado 0.58
Kansas 0.24
Oklahoma State -0.95
Oklahoma -1.36
Missouri -1.50
Iowa State -2.13

To say Nebraska dominated the Big 8 in 1995 would be an understatement. They beat every conference opponent by at least 23 points. They pitched two shutouts (Oklahoma and Missouri) and another team netted only a field goal (Kansas). They scored at least 37 points in every conference game and broke the 50-point barrier three times. Their offensive SDPI alone (2.01) would have won the league and their defensive SDPI (1.53) would have finished a close second. Still, the Big 8 was far from a one-team league in 1995. Kansas State, Colorado, and Kansas all finished the season ranked in the top-10. The Jayhawks' ranking was undeserved, with a non-conference slate that included Cincinnati (6-5), North Texas (2-9), TCU (6-5), and Houston (2-9) coupled with a combined drubbing of 82-10 at the hands of Nebraska and their arch-rivals in Manhattan, but Kansas State and Colorado were legitimate top-10 squads. The Big 8's four bowl teams won their bowl games by a combined score of 205-81 for an average margin of victory of 31 points, with no margin being less than 21.

1995 SEC Summary

Standings

East
Florida 8-0
Tennessee 7-1
Georgia 3-5
South Carolina 2-5-1
Kentucky 2-6
Vanderbilt 1-7

West
Arkansas 6-2
Alabama 5-3
Auburn 5-3
LSU 4-3-1
Mississippi 3-5
Mississippi State 1-7

SDPI Standings

Florida 3.08
Tennessee 1.23
LSU 0.98
Auburn 0.87
Alabama 0.68
Arkansas 0.42
Georgia -0.53
Mississippi -0.86
Kentucky -0.98
South Carolina -1.52
Vanderbilt -1.63
Mississippi State -1.75

Much like the Cornhuskers, Florida dominated their league in 1995. The Auburn Tigers hung within 11 points of the Gators, but that was the closest an SEC team came to knocking them off. The Gators were held below 30 points only twice (they scored 28 in back-to-back weeks against Mississippi and LSU). Over in the SEC West, it appears only the fourth best team in the division took the crown. The Hogs parlayed a 4-0 record in close conference games and a schedule devoid of Florida (Auburn and LSU faced the Gators) into an SEC Championship Game appearance. The Championship Game was fairly boaring as the Gators humbled the Hogs 34-3. Tennessee was the only other SEC school to finish in the top-10. Somehow they finished #2 in the polls despite losing to the Gators by 25 points. Florida's dominance, while still pronounced, was a notch below Nebraska's.

Fiesta Bowl

The Cornhuskers entered the game as a slight favorite over the Gators (most odds makers had them around three points). The Gators opened the game with a field goal and led 10-6 after the first quarter. That's when the onslaught began. Nebraska scored 29 points in the second quarter; two field goals, a safety, and three touchdowns if you're scoring at home. Incidentally, none of those touchdowns was scored by Tommie Frazier. He scored twice in the third though, one of which was the infamous 75-yard run where he looked to be toying with the defense. The vaunted Gator offense managed only two touchdowns all game. Their third touchdown came courtesy of a Reidel Anthony kickoff return late in the fourth quarter. All told, the Huskers rushed for 524 yards (199 by Frazier), sacked Florida quarterback Danny Wuerffel seven times, and picked off three passes in a 62-24 win.

Saturday, June 16, 2007

Rating the Coaches


Which coaches earned their clipboards last season and which should be forced to hand in their headsets? Everyone’s got an opinion on which coaches did well and which did not last season. In playing around with the numbers, I’ve developed a simple rating system to rate each of the NCAA coaches. First we need to come up with a reasonable preseason expectation for each team. To do this, we could peruse numerous preseason magazines and come up with an average, or we could save some time and come up with a simple formula like this:

Win % Last Season (50%) + Win % 2 Yrs Ago (20%) + Win % 3 Yrs Ago (10%) + .500 (20%)

The four components are winning percentage for the previous three seasons; with each season decreasing in importance as the distance from the current season increases and the final component is a winning percentage of .500 as teams tend to trend towards .500. Including this component ensures we don’t penalize coaches coming off undefeated seasons because improving upon a 100% winning percentage is impossible. Additionally, we don’t reward coaches who go winless because we assume they will improve at least marginally. Next we just subtract the team’s expected winning percentage from their actual winning percentage. This number is the coach’s rating.

Here's an example of the formula at work for Jeff Tedford of the California Golden Bears:

In 2003 the Bears went 8-6 (.571 win %), in 2004 the Bears went 10-2 (.833 win %), in 2005 the Bears went 8-4 (.667 win %), and in 2006 the Bears went 10-3 (.769 win %). The 2003 win % gets multiplied by .5. The 2004 win % gets multiplied by .2. The 2005 win % gets multiplied by .1. Then we multiply the standard .500 win % by .2.

(.667*.5)+(.833*.2)+(.571*.1)+(.500*.2)=.657 is Cal's expected win % for 2006. Cal actually won at a .769 clip so Tedford's coaching rating for 2006 is +.112 (.769-.657). This means Cal won a little more than 11% more games than was reasonably expected at the beginning of the season. This figure was the fourth best coach rating in the Pac 10 in 2006.

Before we get into the coaching rating portion, it’s important to find out if this expected winning percentage is at least a decent predictor of a team’s record. If it’s not then the coach rating is not a valid statistic. Fortunately it is quite valid. The r squared value for the expected winning percentage predictive power in 2006 was .3437. This means that expected winning percentage explained a little more than 34% of the variation in actual 2006 winning percentage. If we break this number down by BCS and non-BCS schools we find that it is a much better predictor for a BCS school’s record than for a non-BCS school. The r squared value for BCS schools (including Notre Dame) was .4254 in 2006. For non-BCS schools it was only .1705. This is still a decent relationship, but it shows that the records of non-BCS schools tends to vary more from year to year than the records of BCS schools. Consequently, we should not be quite as shocked when non-BCS schools see a substantial jump in their winning percentage. BCS schools live in a more caste-dominated society where the divisions between upper, middle, and lower classes are rigid and defined. Non-BCS schools on the other hand reside in a more socially unpredictable society where the lines between the three classes are much less defined. With that out of the way, here are the best coaches from 2006.

Dick Tomey (San Jose State) +.392

Jim Grobe (Wake Forest) +.389

Bronco Mendenhall (BYU) +.372

Greg Schiano (Rutgers) +.340

Rich Brooks (Kentucky) +.309

Todd Graham (Rice) +.296

June Jones (Hawaii) +.290

Chris Petersen (Boise State) +.278

Urban Meyer (Florida) +.276

Frank Solich (Ohio) +.271

At worst, this rating seems to be a solid predictor of coach of the year award winners. Petersen won the Paul 'Bear' Bryant Coach of the Year Award, Jim Grobe won the Bobby Dodd Coach of the Year Award, and Greg Schiano won the Walter Camp, Eddie Robinson, and Home Depot Coach of the Year Awards.

Now here are the worst coaches from 2006.

Tom Amstutz (Toledo) -.263

Gregg Brandon (Bowling Green) -.268

Pat Hill (Fresno State) -.289

Chuck Amato (NC State) -.294

Jeff Genyk (Eastern Michigan) -.297

Jack Bicknell (Louisiana Tech) -.329

Walt Harris (Stanford) -.354

Dan Hawkins (Colorado_ -.367

Tommy West (Memphis) -.427

Shane Montgomery (Miami, Ohio) -.467

Three of these gentlemen were axed after the season (Amato, Bicknell, and Harris) and several others are on the hot seat heading into 2007 (Genyk and Montgomery). Of course, some are also good coaches who just had poor seasons (Amstutz, Hill, Hawkins, and West). Now here are the best coaches by conference.

ACC
Jim Grobe (Wake Forest) +.389

Big East
Greg Schiano (Rutgers) +.340

Big 10
Bret Bielema (Wisconsin) +.235

Big 12
Dennis Franchione (Texas A&M) +.215

Pac 10
Mike Riley (Oregon State) +.208

SEC
Rich Brooks (Kentucky) +.309

Conference USA
Todd Graham (Rice) +.296

MAC
Frank Solich (Ohio) +.271

Mountain West
Bronco Mendenhall (BYU) +.372

Sun Belt
Larry Blakeney (Troy) +.166

WAC
Dick Tomey (San Jose State) +.392

And finally the worst coaches by conference.

ACC
Chuck Amato (NC State) -.294

Big East
Randy Edsall (Connecticut) -.203

Big 10
Pat Fitzgerald (Northwestern) -.205

Big 12
Dan Hawkins (Colorado) -.367

Pac 10
Walt Harris (Stanford) -.354

SEC
Mike Shula (Alabama) -.185

Conference USA
Tommy West (Memphis) -.427

MAC
Shane Montgomery (Miami, Ohio) -.467

Mountain West
Chuck Long (San Diego State) -.181

Sun Belt
Darrell Dickey (North Texas) -.127

WAC
Jack Bicknell (Louisiana Tech) -.329

Obviously this system is not meant t0 be the end-all, be-all of coaching ratings. I don't think Rich Brooks is a better coach than Steve Spurrier, but in accordance with exceeding preseason expectations, Brooks was better in 2006.

Saturday, June 09, 2007

Fluck


When I blog about teams, I talk to a great extent about how luck and random chance are a significant determinant to which team wins a college football game. A lot of those factors that equate to luck are random chance are not easily measured, a guard missing a block that leads to a stuff on fourth and goal, a hold that wasn't called, a gunner out of position on a kickoff that leads to a great return to name a few, but there is one facet of luck that can easily be measured--fluck or fumble luck.

When a team fumbles the football, one team recovers it and one team does not. The result of the fumble has a zero-sum outcome. One team is very happy (or relieved if they were also the team that fumbled) and the other is disappointed. On average, a team will recover half of the combined fumbles it causes and its opponents cause. Of course, fumble recoveries are not evenly divided amongst teams. Some teams recover a high percentage and others recover a low percentage. It stands to reason that fumble recoveries can play a crucial role in who wins and who loses. Well, let's find out. Using the great website, CFBstats.com, I took each college football teams fumble recovery percentage and compared it with their winning percentage to see if fumble recovery percentage was a good predictor of winning percentage. CFBstats has data from 2004-2006, so there are 353 team seasons, in my opinion, a significant sample size. The r squared value, for an explanation of r squared click here, for fumble recovery percentage and winning percentage is almost nonexistent. The value is .002. This means that less than one percent of the variation in a team's winning percentage is explained by that team's fumble recovery percentage.

Well that settles it then. Fumble recoveries have almost no correlation whatsoever to winning percentage. Hence they are not important. That doesn't make much sense does it? Of course fumble recoveries play a role in winning and losing. How else can we examine and prove this phenomenon is true? Let's look at the 'best' and 'worst' fumble recoverers (top 10 and bottom 10) in 2004 and 2005 and see how they performed the next season, both in recovering fumbles and in winning percentage. I use quotation marks because recovering fumbles is not a skill, so luckiest and unluckiest are probably more apropos terms.

2004 Best Fumble Recoverers
Team/Fumble Recovery %/2004 Record

Buffalo/78%/2-9
Iowa/69.2%/10-2
Oklahoma/65.8%/12-1
Utah/63.4%/12-0
Texas Tech/63.3%/8-4
Air Force/63.2%/5-6
Stanford/63%/4-7
Oklahoma State/61.8%/7-5
Northwestern/61.5%/6-6
Florida/61.3%/7-5

Combined, these 10 teams recovered 65.4% of fumbles and had a record of 73-45 (.619 winning percentage). Here's what happened in 2005.

Team/Fumble Recovery %/2005 Record

Buffalo/48.8%/1-10
Iowa/41.4%/7-5
Oklahoma/51.9%/8-4
Utah/46.3%/7-5
Texas Tech/64.4%/9-3
Air Force/51.2%/4-7
Stanford/47.1%/5-6
Oklahoma State/49.1%/4-7
Northwestern/45.5%/7-5
Florida/70.7%/9-3

I lack any HTML skills to create tables in blogger, so the values have been color coded. Values in red indicate a decline from the previous season and values in black indicate an improvement. In 2005, the top 10 fumble recoverers from 2004 combined to recover 52% of fumbles (down from 65.4% in 2004) and saw their record decline from 73-45 (.619) to 61-55 (.526). Only two of the teams recovered a higher percentage of fumbles in 2005 than they did in 2004 (Texas Tech and Florida) and while four teams did improve their record in 2005 (Texas Tech, Stanford, Northwestern, and Florida), three of them improved by only one game. Conversely three teams declined by at least three games (and one by two and a half).

Now the other side of the coin, the worst fumble recoverers from 2004.

2004 Worst Fumble Recoverers
Team/Fumble Recovery %/2004 Record

Illinois/32.1%/3-8
Tulane/32.4%/5-6
UNLV/34.1%/2-9
Ohio State/34.3%/8-4
NC State/35.1%/5-6
Cal/35.3%/10-2
UCLA/35.3%/6-6
Kansas/35.5%/4-7
Georgia Tech/35.7%/7-5
Baylor/36.7%/3-8

Combined, these 10 teams recovered 34.7% of fumbles and had a record of 53-61 (.465 winning percentage). Here's what happened in 2005.

Team/Fumble Recovery %/2005 Record

Illinois/51.7%/2-9
Tulane/36.7%/2-9
UNLV/45.2%/2-9
Ohio State/44.4%/10-2
NC State/55.6%/7-5
Cal/52.8%/8-4
UCLA/55.1%/10-2
Kansas/46.7%/7-5
Georgia Tech/55.2%/7-5
Baylor/37.8%/5-6

Once again the values are color coded. Green means the value stayed the same. The bottom 10 fumble recoverers from 2004 saw their fumble recovery rate improve to 47.9% in 2005 (from 34.7%) and their cumulative record improved from 53-61 (.465) to 60-56 (.517). Every team saw their fumble recovery rate improve and half the teams saw their record improve. Four of the five teams that improved (Ohio State, UCLA, Kansas, and Baylor) saw their record jump by at least two games and the other team (NC State) improved by a game and a half. UNLV and Georgia Tech had the same record both seasons.

Now onto 2005.

2005 Best Fumble Recoverers
Team/Fumble Recovery %/2005 Record

Florida/70.7%/9-3
Southern Miss/70.3%/7-5
Wisconsin/70%/10-3
Texas/67.7%/13-0
Texas Tech/64.4%/9-3
Mississippi/64.1%/3-8
Virginia Tech/62.8%/11-2
Colorado State/62.8%/6-6
Louisiana Tech/62.8%/7-4
TCU/61.9%/11-1

Combined, these 10 teams recovered 65.6% of fumbles and had a record of 86-35 (.711 winning percentage). Here's what happened in 2006.

Team/Fumble Recovery %/2006 Record

Florida/50%/13-1
Southern Miss/43.2%/9-5
Wisconsin/46%/12-1
Texas/55.6%/10-3
Texas Tech/43.1%/8-5
Mississippi/61.8%/4-8
Virginia Tech/46.7%/10-3
Colorado State/41.7%/4-8
Louisiana Tech/50.9%/3-10
TCU/43.8%/11-2

In their follow up campaigns, these 10 teams combined to recover 48.2% of fumbles (down from 65.6%) and saw their record decline from 86-35 (.711) to 84-46 (.646). Every team saw their fumble rate decline. Four teams did improve their record (Florida, Southern Miss, Wisconsin, and Mississippi), and of those four, all but Mississippi improved significantly (at least one game). Five teams declined by at least one game with three declining by at least two games (Texas, Colorado State, and Louisiana Tech).

The Worst Fumble Recovers

2005 Worst Fumble Recovers
Team/Fumble Recovery %/2005 Record

Wyoming/19%/4-7
LSU/26.8%/11-2
ECU/31.6%/5-6
Auburn/35.9%/9-3
Arizona/36.4%/3-8
Tulane/36.7%/2-9
Baylor/37.8%/5-6
New Mexico State/38.2%/0-12
UTEP/38.6%/8-4
UAB/39.4%/5-6

Combined, these 10 teams recovered 33.8% of fumbles and had a record of 52-63 (.452 winning percentage). Here's what happened in 2006.

Team/Fumble Recovery %/2006 Record

Wyoming/51.2%/6-6
LSU/34.9%/11-2
ECU/47.8%/7-6
Auburn/53.5%/11-2
Arizona/63.6%/6-6
Tulane/38.6%/4-8
Baylor/43.9%/4-8
New Mexico State/39.1%/4-8
UTEP/56.4%/5-7
UAB/68.9%/3-9

The bottom 10 fumble recoverers from 2005 saw their fumble recovery rate improve to 49.8% in 2006 (from 33.8%) and their cumulative record improved from 52-63 (.452) to 61-62 (.496). Every team saw their fumble recovery rate improve and six teams saw their record improve. Every team that improved (Wyoming, ECU, Auburn, Arizona, Tulane, and New Mexico State) improved by at least one game. LSU had the same record both seasons.

Conclusions:

While fumble recovery rate in itself does not determine a team's fortunes, a good rate can help mediocre teams have good seasons (Louisiana Tech in 2005) and very good teams have great seasons (Utah and Oklahoma in 2004 and Texas in 2005). Conversely, a poor rate can cause mediocre teams to have poor seasons (Wyoming in 2005) and bad teams to go winless (New Mexico State in 2005). It is an important fact to know about a team, but needs to be used in conjunction with many other factors when attempting to predict a team's future success. With that in mind, here are the best and worst fumble recoverers from this past season.

2006 Best Fumble Recoverers
Team/Fumble Recovery %/2006 Record

Michigan/71.9%/11-2
UCLA/68.9%/7-6
UAB/68.9%/3-9
Colorado/68.2%/2-10
San Diego State/65%/3-9
Louisiana-Monroe/64%/4-8
Arizona/63.6%/6-6
Mississippi/61.8%/4-8
Northern Illinois/61.8%/7-6
Rice/61.2%/7-6

If the past two seasons are any indicator between five and six of teams should see their record decline in 2007. My guesses are Michigan (hard to top 11-2 even if they are the best team in the Big 10), UAB (new coach and killer road schedule--Michigan State, Florida State, Tulsa, Mississippi State, and ECU are the highlights), Mississippi (play in the SEC West), Northern Illinois (lose Garrett Wolfe and return one quarterback with experience, Dan Nicholson, who didn't exactly set the world aflame when he had a mega-threat in the backfield with him), and Rice (new coach, 5-1 record in close games in 2006, perennial loser).

2006 Worst Fumble Recoverers
Team/Fumble Recovery %/2006 Record

Ohio State/32.4%/12-1
Stanford/32.5%/1-11
Arkansas/33.3%/10-4
UNLV/34.1%/2-10
Nebraska/36.8%/9-5
South Florida/37.5%/9-4
Tulane/38.6%/4-8
UCF/38.7%/4-8
Louisville/38.8%/12-1
New Mexico State/39.1%/4-8
Wake Forest/39.1%/11-3

That's actually 11 teams (New Mexico State and Wake Forest tied for 10th worst). If the past two seasons are any indicator, about five or six of these teams should improve in 2007. My guesses are Stanford (hard to get any worse), UNLV (1-3 in close games in 2006), Nebraska (Sam Keller coming in to run Bill Callahan's system), South Florida (two words--Matt Grothe), UCF (George O'Leary hasn't forgotten how to coach and a 2-3 record in close games in 2006), and New Mexico State (0-4 in close games in 2006 and Chase Holbrook returns to run Mumme's system).

Interesting Stat (for me at least):

When Texas won the national championship in 2005, they dominated almost every team they played, save two--Ohio State in Columbus and Southern Cal in the Rose Bowl. They won those games by three points apiece. In both games, the Longhorns combined to fumble eight times, yet only lost two. The Buckeyes and Trojans combined to lay the ball on the ground four times, losing two of them. All told, there were 12 fumbles in those two games. The Longhorns recovered eight of them (66.7%). The Longhorns were one of the best teams in the nation in 2005 even without the football gods on their side. The difference between immortality and a fading memory is a few lucky bounces.

Monday, June 04, 2007

Winning the Close Ones


A team's record in close games is a topic I have examined several times here at Statistically Speaking. Not to beat an old horse, but the off-season is very long, so here's another look. If you want a refresher on the other findings regarding close games, you can read about them here, here, here, and here.

This post will examine how well six different team statistics correlate with a team's record in close games. The sample size for this test is every Division IA team that played at least three close games in 2006 (100 teams). The independent variable is always the team statistic that is being evaluated and the dependent variable is a team's winning percentage in close games.

Turnover Margin

The first statistic we'll examine is turnover margin. Turnover margin can be positive or negative and is simply the number of turnovers a team commits subtracted from the number of turnovers it gains. It is calculated on a per game basis. I am using turnover margin instead of the more familiar (to NFL fans) plus minus ratio because college football teams do not play the same number of games. The best team in terms of turnover margin in 2006 was the Minnesota Golden Gophers. They played 13 games during which they lost 14 turnovers and gained 32. Their turnover margin was +1.38 per game. This means they averaged close to one and a half fewer turnovers per game than their opponents. The worst team in 2006 was the Army Black Knights. They played 12 games and committed 37 turnovers while gaining only 19 for a turnover margin of -1.50.

Turnover margin has a positive relationship with a team's record in close games. This means that as a team's turnover margin improves, a team's record in close games should also improve. However, the relationship is very weak. The r squared value is only .0502 meaning that only about 5% of the variation in a team's record in close games is explained by their turnover margin. The weakness in this relationship is best illustrated by Minnesota. Despite leading the nation in turnover margin, they finished 1-3 in close games.

3rd Down %

3rd down % is the percentage of times a team converts 3rd downs into first downs by picking up the necessary yardage. The NCAA leader in this category in 2006 was the Hawaii Warriors. They converted almost 58% of their 3rd downs into 1st downs (77 out of 133). The worst team at converting 3rd downs was Florida International. The winless Golden Panthers converted 23.5% of their 3rd downs into 1st downs (39 out of 166).

3rd down % also has a positive relationship with a team's record in close games. As a team improves it's conversion percentage it should see improvement in it's record in close games. However, this relationship is even weaker than the one for turnover margin. The r squared value of .025 is less than half that for turnover margin.

3rd Down % Defense

The mirror image of 3rd down %; this is the percentage of times a team prevents their opponent from gaining the necessary yardage to move the sticks on third down. The best team at preventing their opponents from converting 3rd downs in 2006 was the Virginia Tech Hokies. Opponents converted only 27% of their 3rd downs into first downs (50 out of 185). The easiest team to convert 3rd downs on was the Air Force Falcons. Opponents converted over 56% of their 3rd downs into first downs (79 out of 141). The Falcons were the only team to allow a conversion rate greater than 50% in 2006.

3rd down % defense has a negative relationship with a team's record in close games. As a team allows a higher conversion rate, their record in close games should decline. Once again this relationship is also weak with an r squared value of only .0963.

FG%

Clutch kickers should help a team pull out close games. Field goal % is simply the number of made field goal divided by the number of field goal attempts. The North Carolina Tar Heels made all ten of their field goal attempts in 2006. For teams with more than ten attempts, the Southern California Trojans made 16 of their 17 field goal attempts on the year (94.1%). The Kent State Golden Flashes had the worst accuracy, converting only two of their ten field goal attempts. For teams with more than ten attempts (barely), the Duke Blue Devils made four out of eleven (36.4%) to finish last.

Field goal % has a positive relationship with a team's record in close games. This means as field goal percentage improves, a team's record in close games should also improve. However, this relationship is nearly non-existent. The r squared value is a paltry .009. How can something that seems so vital to a team's success in close games have no relationship? One need only look at the 2006 Florida Gators to devine an answer. The immediate thought that comes to mind when discussing field goal % and close games is that a team with a good kicker will win those games more often because of their kicker. What if they win those games more often in spite of their kicker. In 2006, Christ Hetland attempted all of Florida's 15 field goals. He made six of them (40%). In 2006, Florida played five close games and had a 5-0 record (discounting the Auburn game that was a ten point margin thanks to the games final play). In their one-point win over Tennessee, Hetland missed both his field goal attempts. In their seven-point win over Georgia, he was again 0 for 2. In their one-point win over South Carolina, he did manage to make one of his two attempts. In their seven-point win over Florida State he missed both his attempts. Even if he had made both against Tennessee, that game would have come down to the wire, but leaving points on the board against Georgia and Florida State made those games much closer than they should have been. Another make against South Carolina and it wouldn't have take a block party from Jarvis Moss and Ray McDonald to squeak out a win. Despite his best efforts, Chris Hetland failed to sabotage the Gators national title dreams.

Scoring Offense

Scoring offense is simply the number of points scored divided by the number of games played. Hawaii led the nation in scoring in 2006, averaging 46.86 points per game. Once again Florida International brought up the rear averaging only 9.58 points per game.

Scoring offense has a positive relationship with a team's record in close games. As a team scores more points, their record in close games should improve. Once again, the relationship is weak. The r squared value for the correlation is only .0479.

Scoring Defense

Scoring defense is the number of points allowed divided by the number of games played. Virginia Tech allowed the fewest points per game in 2006 (11 per game). At the other end of the spectrum was Louisiana Tech. The Bulldogs allowed 41.7 points per game.

Scoring defense has a negative correlation with a team's record in close games. As a team allows more points, their record in close games should decline. Th relationship is still relatively weak with an r squared value of .1214.

None of the six team statistics examined here is highly adept at predicting a team's record in close games. This seems to be further proof that close games are nothing more than coin flips or crap shoots. However, something interesting does show up when you take a second look at the r squared values.

Scoring Defense: .1214
3rd Down % Defense: .0963
Turnover Margin: .0502
Scoring Offense: .0479
3rd Down % Offense: .025
FG %: .009

Both defensive statistics have a much stronger correlation (although still relatively weak) than any other statistic, especially the offensive statistics. This seems to reiterate a finding I posted about a year ago that good defensive teams tend to win more than their fair share of close games. Just some examples off the top of my head are Ohio State in 2002 and my beloved Demon Deacons in 2006.

Wednesday, May 30, 2007

Historical SDPI: The Big 10

After running the SDPI numbers for all 11 conferences in 2006, I thought it would be an interesting sojourn through recent football history to look back at SDPI for the six BCS conferences throughout the entirety of the BCS era (98-06). It also gives me an excuse to add some pretty little graphs to the site. Don't know what SDPI is? Click here for an answer. Remember, its performance, not achievement, so years with the highest win totals may not actually be a certain team's best season. And its also only conference play, so any non-conference action, championship games, and bowl game are excluded. We'll continue with a look at the Big 10. After each team's graph, there is a paragraph of commentary followed by the number of first place SDPI finishes or if there are no such finishes, the highest SDPI finish.


Illinois


A pair of Ron's have guided the Illini through the duration of the BCS era: Turner for the first seven seasons and Zook for the last two. Under Turner, the program saw both the highs (a conference title in 2001) and the lows (two combined Big 10 wins in his final two seasons). In Zook's first season, the program dipped to its lowest point--over four standard deviations below average with a winless Big 10 season in 2005, but improved substantially with an influx of talent in 2006 and are a team to be wary of entering 2007.

Best SDPI Finish: 2nd (2001)


Indiana


Cam Cameron is responsible for the first four seasons, Gerry DiNardo the middle three, and Terry Hoeppner the last two. Cameron's teams were generally pretty pathetic up until 2001 (Antwaan Randle El's senior season), when the Hoosiers were actually quite solid and with a little luck could have gone bowling. The Hoosiers were 4-4 in conference play and 5-6 overall, but with a little better non-conference scheduling (they lost to NC State and Utah who were a combined 15-9) and some fortuitous bounces (they lost to Utah by two points) could easily have finished 6-5 or 7-4 and saved Cameron's job. I guess things have worked out for Mr. Cameron though. Cameron was replaced by former Vanderbilt and LSU coach Gerry DiNardo. In DiNardo's first two seasons, the Hoosiers went 3-9 and 2-10 respectively (1-7 in conference play both seasons), but things appeared to be looking up as 2004 opened. The Hoosiers destroyed Central Michigan 41-10 in their first game and pulled off one of the biggest shockers of the season when they ended Oregon's 21-game home winning streak against non-conference opponents (dating back to 1994). Looking back, it's easy to see why Indiana won, and it has a lot more to do with what the Ducks did--almost any team with a competent Division IA (especially BCS) caliber team would have beaten Oregon that day. The next week, the Hoosiers lost by 29 points to a Kentucky team that would finish 2-9. The Hoosiers won only once more on the season and that was the end of the line for DiNardo. His replacement Terry Hoeppner has led the Hoosiers to nine wins in two seasons and many feel Indiana has the look of a team on the rise. I don't but it. SDPI sees them as improving slightly, but mostly treading water in Hoeppner's first two seasons. The Hoosiers four Big 10 wins under his guidance (against 12 defeats) have come against teams with a cumulative record of 14-34. The Hoosiers have also lost to a IAA school and beaten another by just four points. While I have been wrong at least once before, don't bet on the Hoosiers finding their way into a bowl game this season.

Best SDPI Finish: 5th (2001)


Iowa


1998 was the end of the Hayden Fry era. What a fantastic 20 years it was. Three Big 10 titles, 14 bowl games, and 143 wins are the highlights. He was succeeded by Kirk Ferentz, who has guided the Hawkeyes ever since. The Hawkeyes bottomed out in Ferentz's first season, going winless in conference play and finishing in the SDPI cellar as well. His teams steadily improved over the next three seasons culminating in an undefeated Big 10 season and Orange Bowl appearance in 2002. Looking closely at the 2001 team that finished only 7-5, their sudden jump to conference champion is not totally surprising. They outscored their opponents by 133 points and were a tough luck 2-4 in close games. In 2002, they returned the core of their team and improved in the luck department (3-1 in close games) enabling them to share the conference title. Since that 2002 season, the Hawkeyes have remained a contender in the Big 10 (even sharing another conference title and winning the SDPI crown in 2004). They dipped a bit in 2006, finishing 6-7 overall (2-6 in the Big 10), but were much better than their conference record (6th in conference SDPI). If they can find a suitable replacement for Andrew Tate at quarterback, they area a real darkhorse team in 2007.

First Place SDPI Finishes: 2002 and 2004


Michigan


Lloyd Carr has been in charge of the Wolverines for the entirety of the BCS era. Michigan is the only Big 10 team to have been above average each season in the BCS era. They are also the only Big 10 team to not finish with a losing record in the BCS era. To say they been a consistent Big 10 power is an understatement. They have finished first three times, second once, third twice, fourth twice, and fifth once.

First Place SDPI Finishes: 2000, 2001, and 2003


Michigan State


1998 was Nick Saban's final year in East Lansing, followed by four years of Bobby Williams and four years of John L. Smith. Saban's final team was a pretty pedestrian 4-4 in the Big 10 and 6-6 overall. However, they did ruin the national titles dreams of Ohio State on a cool November evening in Columbus, knocking off the Buckeyes 28-24. That was the only blemish on the the Buckeyes' record as they would win every other game by at least 10 points. Saban departed after the season, but the cupboard was stocked for his successor Bobby Williams. The Spartans ascended in 1999, winning 10 games and vying for the conference title. They regressed in 2000, rebounded a bit in 2001, and regressed some more in 2002. Seeking some stability, and not more up-and-down seasons, the Spartans replaced Williams with Louisville coach John L. Smith. As this video and this snippet show, Smith was anything but stable during his stint as head coach. Like Williams, Smith also peaked in his first season as coach and from then on his teams declined steadily exploded spectacularly. To be fair though, Smith will always have at least one game he remembers fondly.

Best SDPI Finish: 4th (1999, 2003, and 2004)


Minnesota


Glen Mason has been the only coach Minnesota has known during the BCS era, joining the Gophers in 1997. That will all change in 2007 as Tim Brewster takes over the program. Mason did a commendable job at Minnesota (to go along with his solid performances at Kansas and Kent State) taking the Gophers to seven bowl games in ten seasons. His teams were occasionally good, always competitive, and never great nor terrible. He could have done a lot worse. The Gophers do have tradition (six national titles--the last coming in 1960), but they don't really have recent tradition so Mason should not be fustigated for failing to turn Minnesota into Ohio State. Tim Brewster has a long way to go to come close to equaling his predecessor.
Does the dome make a difference?
Minnesota's Home Conference Record (98-06): 19-17 (.528)
Minnesota's Road Conference Record (98-06): 12-24 (.333).

Best SDPI Finish: 2nd (2003)


Northwestern


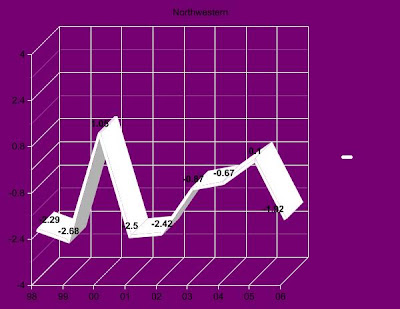
1998 was Gary Barnett's swan song in Evanston. Randy Walker was the head coach from 1999 through 2005 and Pat Fitzgerald just finished his first season as head coach. Barnett's final season was pretty bad, as was Walker's first season. Then just like they had done half a decade before, Northwestern had an inexplicably good season in 2000 (tying for the Big 10 title). The Wildcats struggled through two more down seasons before beginning a three-year run of improvement that culminated with a bowl big in 2005. The team regressed in 2006 partly because the 2005 team was quite lucky (4-1 in close games) and partly because of a sudden, tragic death.

Best SDPI Finish: 3rd (2000)


Ohio State


John Cooper is responsible for the first three seasons and Jim Tressel the last six. Looking back, its clear the Buckeyes made a good choice in hiring Tressel, but its clear if Cooper was to be fired, it should have been after the 1999 season. Ironically, Ohio State's national championship team has the second lowest conference SDPI of Tressel's six season. The reason for this is the 2002 team's incredible lack of dominance. They amazingly won seven of their 14 games by seven points or less. Luckeyes would be a more apropos name.

First Place SDPI Finishes: 1998, 2005, and 2006


Penn State


Joe Pa has led the Penn State program since 1966. In the BCS era, his teams have occasionally had a tough go of it. His Nittany Lions have been below average four times in nine seasons. However, in those four seasons, they were never really terrible. They were 4-4 in conference play in both 2000 and 2001, but failed to qualify for a bowl game either season thanks to a non-conference schedule that included games against Toledo (10-1) and at Pitt (7-5) in 2000 and a home date with eventual national champion Miami (12-0) and a trip to Virginia to close 2001. If they had played more Louisiana-Monroe's or Middle Tennessee's, instead of those challenging non-conference games their bowl streak would not have been interrupted. Until 2003 and 2004 when they were a combined 3-13 in conference games. However, that record is deflated by a 1-6 record in close conference games over those two seasons. A little better luck, and the Nittany Lions would have been a middle-of-the-pack team and not a cellar dweller.

Best SDPI Finish: 2nd (1999, 2002, and 2005)


Purdue


Joe Tiller and his spread offense have revived the Purdue program since arriving in West Lafayette from Wyoming in 1997. Amazingly, Purdue has been below average only twice in the BCS era. Not bad for a program that had not posted a winning record in the twelve previous seasons before is arrival. Here's an interesting fact I stumbled upon while examining Purdue's performance under Tiller, and another point in the entry into the vagaries of winning close games. In Tiller's first five seasons (97-01) his teams posted a 14-11 (.560) record in close games. That solid record in close games, especially in 2000 (3-2 overall and 3-1 in conference play) helped the Boilers win a Big 10 title. In his five most recent seasons, his teams have compiled a 13-17 (.433) record in close games. Included in than span are the 2002 and 2004 seasons when Purdue went a combined 5-11 (4-8 in conference play) in close games. Despite being one of the better teams in the Big 10 both seasons, the Boilers only managed to go 14-11 overall (8-8 in the Big 10).

Best SDPI Finish: 2nd (1998)


Wisconsin


Occasionally great, usually solid, rarely bad. That's been the modus operandi for the Badgers, first under Barry Alvarez and then under Bret Bielema. The Badgers only legitimately poor season came in 2001. They did finish below average and 2-6 in Big 10 play in 2002, but that was primarily due to a 1-4 record in close conference games.

First Place SDPI Finishes: 1999