The college football season begins in 5 days, so its high time I put together a little preview. This preview is nowhere near as in depth as Phil Steele, The Sporting News, CNNSI, ESPN, College Football News, etc. al, but I think you will find some nuggets of knowledge that those guys may have left out. What follows is a conference-by-conference preview with the exception of th MAC (too many teams that I know nothing about), the Sun Belt (call me an elitist, but I just don't care that much who loses the New Orleans Bowl to a Conference USA squad), and Independents (because there's just 4 of them). I'll list my division/conference winners, one team guaranteed to be better than expected (Angels and Demons team), one team guaranteed to be worse than expected (Da Vinci Code team), and one interesting stat for each conference.
ACC
Coastal Winner: Miami
The Canes crushing loss to LSU in the Peach Bowl was an aberration. Before that game Miami had given up more than 20 points only once all season (in a triple OT game against Clemson). They get their toughest conference games (Florida State, Virginia Tech, and Boston College) at home. The only concern I have is the relative inexperience of the offensive line.
Atlantic Winner: Florida State
The Noles do have to travel to Miami and perennial thorn in the side NC State, but they get their two main division rivals (Clemson and Boston College) in Tallahassee. Quarterback Drew Weatherford was erratic at times last season, but should improve in his second year as the starter.
Winner: Miami
If Miami wins the conference, it probably means they beat the Noles twice. While this may be tough to do, it actually happened just three seasons ago.
Angels and Demons Team: Boston College
While no one is predicting a serious downturn for BC, most believe Clesmson and possibly even Maryland will usurp their position of Ed McMahon to Florida State's Johnny Carson in the Atlantic Division. It won't happen. BC gets both the aforementioned teams at home in Chestnut, and while they didn't get any favors from the scheduling gods (drawing Virginia Tech and Miami from the Coastal Division), three conference losses will have them sitting in second place all over again.
Da Vinci Code Team: Clemson
Its not that I think Clemson will be bad, I'm just not buying the hype of the Tigers possibly winning the Atlantic Division. Conference road games at Florida State, Boston College, Virginia Tech, and always tough Wake Forest, plus no real easy home dates (North Carolina, Georgia Tech, Maryland, and NC State) add up to at least 4 conference losses in my book.
Important Stat: Wake Forest has gone an amazing 4-8 in close games (8 points or less) the past two seasons. With a little bit of luck the Deacons could be bowling over the holidays for the first time in 4 years.
Big East
Winner: Louisville
The Ville has only three conference road games with the only real challenge coming at Pitt. They return quarterback Brian Brohm and the other Bush (running back Michael) to one of the nation's best offenses. The do lose pass rush specialist Elvis Dumervil on th defensive line, but actually return their entire secondary and all but one member of the linebacking corps.
Angels and Demons Team: Connecticut
I definitely think Pitt has a chance to win the conference, but a multitude of other analysts also agree. So I'll take a team further down the standings that many are sleeping on...the UConn Huskies. The Huskies have an exciting player in quarterback DJ Hernandez. He played significantly in only two games as a true freshman (against Cincinnati and Louisville), but managed 5 touchdown passes and just 1 interception in those games. He is also a good runner who can make plays with his feet. In addition to this, the Huskies had 7 Pythagorean wins (as opposed to 5 actual wins) last season, so if things break their way they could be headed back to a bowl game.
Da Vinci Code Team: West Virginia
Forget about the team that squeaked by Georgia after nearly blowing a big lead in the Sugar Bowl and remember the team that got pasted by 17 at home against Virginia Tech. West Virginia was good last year, but not 11-1 good. With road tests at Louisville and Pitt the Mountaineers will not repeat as Big East champs.
Important Stat: Luck was certainly not evenly distributed in the Big East last season. West Virginia and Cincinnati went a combined 7-0 in close games, while Pitt, South Florida, and Syracuse went a combined 0-7. Look for West Virginia and Cincinnati to regress and fall in the standings. Pitt, South Florida, and Syracuse should have some better luck and impove their records this season.
Big 10
Winner: Iowa
A 7-5 year was probably disappointing for most Hawkeyes fans, but lets examine the past two seasons. In 2004, Iowa went 10-2. However, their Pythagorean record was only 8.2-3.8. They were an amazing 5-0 in close games and were +13 in turnover differential. In 2005, they went 7-5, but actually had a better Pythagorean record than the season before (8.68-3.32). However, they were now 0-3 in close games and -1 in turnover differential. This season, the Hawkeyes get Ohio State at home and of their road games, only against Michigan should they be an underdog. They also return their entire backfield and 3/5 of the offensive line. On the other side of the ball, they have all their defensive linemen coming back. This season is tailor-made for Iowa to make some real noise.
Angels and Demons Team: Michigan State
There's not a more appropos moniker for a team like Michigan State. The epitome of helter-skelter. In 2004 they drubbed ranked teams Minnesota and Wisconsin while falling to Rutgers and Hawaii. In 2005, they upset Notre Dame early on, and then proceeded to lose by 35 to Northwestern. I think they put it all together this season. By that I mean have a solid, if unspectacular bowl team (say 8-5 or 9-4).
Da Vinci Code Team: Ohio State
No way they live up to expectations, especially with that schedule. At Texas in non-conference play, coupled with conference road games against Iowa and always dangerous Michigan State, plus home dates against Michigan and Penn State, equals at least 2 regular season losses. And lest we forget, two starters return on defense.
Important Stat: Over the last two seasons, Northwestern was 10-3 in close games. They gave up over 33 points per game last season. Their quarterback, Brett Basanez, graduated. Losing Randy Walker is a terrible tragedy, but this team would be destined to decline if Bear Bryant was coaching them.
Big 12
North Winner: Colorado
The Buffs avoid the South's top team (Texas) and get one of the better teams (Texas Tech) at home. In their own division, they get to host one of their biggest threats (Iowa State), but have to hit the road to face the other (Nebraska). With Dan Hawkins at the helm, the Buffs will once again be fodder for the South champion in December.
South Winner: Texas
I wasn't really buying Oklahoma before Rhett Bomar was given the boot primarily because they actually outperformed their Pythagorean record (7.08-4.92) and had a solid record (4-2) in close games. Now I'm definitely all in with the Longhorns for the South title.
Winner: Texas
It won't be a 70-3 throttling like last season, but the Horns should handle the Buffs in the Big 12 Championship Game.
Angels and Demons Team: Texas A & M
The Aggies could pass Texas Tech in the standings (they get the Red Raiders at home). Plus they have their entire defensive secondary returning (they should improve on the 31 points per game they gave last season) and quarterback Stephen McGee looked like the real deal in the season finale.
Da Vinci Code Team: Missouri
Phil Steele has them third in the North?! No way. They lose their best player in quarterback Brad Smith and were actually better team in 2004. Their Pythagorean record in 2004 was 6.62-4.38. In 2005 it was 6.38-5.62. The prime culprit in their improvement was their record in close games. They improved from 2-2 to 3-1. If they go 3-1 in 2004, they finis 6-5 instead of 5-6 and qualify for a bowl. If they go 2-2 in 2005, they finish 5-6 and South Carolina fans don't have visions of Brad Smith running wild all offseason.
Important Stat: Defense will determine if Texas Tech and Nebraska are as good or better than last season. For all the talk about how the west coast offense is clicking in Nebraska, the Huskers actually scored fewer points per game in 2005 than they did in 2004. Their improvement was tied to their defense allowing 6 points per game fewer. Similarly, Texas Tech did improve their scoring by about 3 points per game, but more importantly their defense held opponents to about 8 points per game fewer in 2005 versus 2004.
Important Stat II: Consecutive 7-5 seasons may fool you into believing that Iowa State did not improve in 2005. But they did. In 2004 the Cyclones finished 7-5. They were outscored by 13 points on the year resulting in a Pythagorean record of only 5.63-6.37. They were a very solid 5-3 in close games. In 2005 they again finished 7-5. They outscored their oponents by 109 points resulting in a Pythagorean record of 8.58-3.42. They were a terrible 1-4 in close games. The only thing that will prevent them from winning the North this season is their schedule. They drew both Oklahoma at Texas for road dates against the South, as well as a home date agaunst Texas Tech. Within their own half, they must travel to Colorado to face the Buffs. Quarterback Bret Meyer, running back Stevie Hicks, and receiver Todd Blythe form a solid core, but the Cyclones have their work cut out for them if they want to finally win the North.
Conference USA
West Division Winner: Tulsa
The western division is set to Tulsa time. Last season's Conference USA champs return 9 starters on defense and 7 on offense including quarterback Paul Smith. In conference play, they get division rival UTEP at home as well as East Division power Southern Miss. The Golden Hurrican were an amazing +19 in turnover margin last season so expect some regression, but not enough to derail another Conference USA title.
East Division Winner: Southern Miss
The Eagles will be breaking in a new quarterback after the departure of Dustin Almond, but return every other starter on offense save right tackle. The Golden Eagles also had some bad luck last season, finishing 1-3 in close games. Their schedule is tough (especially non-conference with dates at Florida and Virginia Tech as well as a home game against NC State), but they will represent the East in the second Conference USA Championship Game.
Winner: Tulsa
The Golden Hurricane will take care of the Golden Eagles for the second time on the season in the title game.
Angels and Demons Team: Rice
The Owls were horrible last season as other teams feasted on them by an average margin of almost 18 points per game. New head coach Todd Graham has experience turning teams around with West Virginia and Tulsa. In additon, the Owls had a -17 turnover margin last season. As long as they have warm bodies on the field they should improve upon that number. They won't make it to a bowl game, but they should triple and possibly quadruple last season's win total.
Da Vinci Code Team: Central Florida
George O'Leary deserves tremendous credit for taking the Golden Knights from a winless season in 2004 to an 8-5 record in 2005. However, the Knights allowed just as many points as they scored last season and finished a very good 4-1 in close games. Simple regression will prevent Central Florida from winning the East again.
Important Stat: UAB was 1-5 in close games last season. Without career passing leader DarrellHackney, expect the Blazers to impove on last season's record.
Mountain West
Winner: Utah
The Utes came on strong last season by winning four of their last five games. Another season under Kyle Whittingham and the good fortune of getting the other two biggest contenders (TCU and BYU) at home should mean a second Mountain West title in 3 years.
Angels and Demons Team: Wyoming
A lot of folks have the Pokes pegged for last in the Mountain West. I think they could be a surprise mid-level conference team that contends for a bowl. Last season they had terrible luck with fumbles. They didn't fumble extremely often, but when they did they couldn't the ball back. They lost 13 of 15 fumbles. The NCAA average is about 50%. On defense, they recovered only 6 of 27 forced fumbles. A few fortuitous bounces and Wyoming is a 7-5 team this year.
Da Vinci Code Team: TCU
The Horned Frogs are a good team no doubt, but their fans should not have visions of a BCS invite. They were +11 in turnover margin last season, and an amazing 5-0 in close games. Those numbers will come down this season and TCU's record will follow suit.
Important Stat: In 22 seasons at Air Force, Fisher DeBerry has had 4 losing seasons. Half of them have come in 2004 and 2005.
Pac 10
Winner: Southern Cal
The class of the Pac 10 until further notice. If their defense improves over last season, they could win the national championship.
Angels and Demons Team: Oregon State
This was a toss-up between the Beavers and the Cougars from Washington State. In the end, I went with the team that returns 9 starters on offense along with 7 on defense and had a terrible -14 turnover margin last season over the team that could not win a close game in 2005 (1-5).
Da Vinci Code Team: Arizona State
We've been hearing about how the Sun Devils are supposed to break out any year now. Until they play some defense, that won't happen. With only 4 starters returning on that side of the ball, don't expect much improvement this season. The Sun Devils have found the oasis in close games going 6-2 in close games the past two seasons. Any regression and the team could be out of a bowl game. That's the story, morning glory.
Important Stat: UCLA finished 6-2 in conference play last year. They were outscored in those games by 35 points. Expect some serious reversals in luck.
SEC
East Winner: Florida
I'm definitely unsure about this pick. Urban Meyer's team usually dramatically improve offensively in his second season. However, Florida's schedule is unbelievably difficult. Aside from the 5 other teams from the East, they play at Auburn and host Alabama and LSU from the West. However, Georgia has Joe Tereshinski (of Cocktail Party fame or infamy as the case may be), Tennessee will still be inconsistent on offense, and South Carolina used a ot of smoke and mirrors last season. So I have to give it to the Gators by default.
West Winner: Auburn
They were probably the SEC's best team last season, and with quarterback Brandon Cox and running back Kenny Irons returning to anchor a powerful offense, they should be the cream of the crop once again.
Winner: Auburn
If they can avoid the slip ups to inferior teams from last season (at home to Georgia Tech and in the bowl game against Wisconsin) the Tigers could win the National Championship.
Angels and Demons Team: Arkansas
They have gotten a lot of love from Phil Steele and I have to agree with him. The Hogs are 1-7 in close games the ast two seasons. That luck has to change. Plus they have a stud runner in Darren McFadden and whoever turns out to be the starting quarterback (freshman Mitch Mustain or sophomore casey Dick) will have a solid season. If Auburn doesn't win the West, Arkansas will.
Da Vinci Code Team: LSU
Don't read too much into the shellacking they laid on Miami. The Tigers were 5-1 in close games in Les Miles' first season. Their four conference road games are against Florida, Auburn, Arkansas, and Tennessee. They will finish no better than third in the West.
Important Stat: Under Spurrier, the Cock N Fire offense averaged roughly a point per game more than the conservative offense run by Lou Holtz. Will Blake Mitchell and Sydney Rice become the next great passing tandem under Spurrier?
WAC
Winner: Boise State
Boise gets to host their biggest nemesis, Fresno State this season. Quarterback Jared Zabransky is a senior this season. As long as he doesn't channel Chris Rix as he did against Georgia last season, the Broncos should win the WAC. I can't predict an undefeated season thanks to a road game against Utah and a home date with improving Oregon State, but a WAC title should be in the bag.
Angels and Demons Team: Idaho
To the extreme they rock the dome like a vandal. With a home schedule that includes weaker WAC teams like San Jose State and New Mexico State, along with 9 returning starters o offense and 7 on defense, the Vandals should improve on last seasons 3 wins. A 1-3 record in close games also portends some improvement in the luck department. In addition to this, Dennis Erickson, for all his failures in the pro game, is a helluva college coach.
Da Vinci Code Team: Nevada
The Wolfpack finished last season with a 9-3 record, but only had a Pythagorean record of 6.48-5.52. They went 5-0 in close games last season. Boise and Fresno are the class of the WAC, and if the Wolfpack is not careful, they could be passed by both Hawaii and either Idaho or Louisiana Tech.
Important Stat: Hal Mumme's New Mexico State Aggies were buried at the bottom of Division I last season. A -23 turnover differential is partly to blame, so a little improvement in that area could lead to an extra win or two.
Saturday, August 26, 2006

Friday, August 18, 2006
Blog Poll Roundtable I
1. What's the biggest ripoff in this preseason poll? Either pick a team that's offensively over or underrated, or you can rag on a particular voter's bad pick (hey, we're all adults here, we can handle it).
On the whole, I like the poll, with the exception of the top two spots. So we're supposed to believe a team returning 2 starters on defense that must travel to Texas, Iowa, and Michigan State along with hosting Penn State and Michigan is the nation's top team? Yeah the offense should be bang up this season, but they're coached by Jim Tressel, so you know he's gonna play it close to the vest a time or two against the better teams on the schedule. I can see top 5, but #1 overall? And the 'Horns at #2? With the loss of Vince Young, who was the difference maker in games against Ohio State, USC, Texas A&M, and Oklahoma State, the Horns are a definite top 10 team as they have been for most of Mack Brown's tenure, but not the 2nd best team in the country. Without a player of Young's caliber, Texas could not have completed the stirring second half comeback over Oklahoma State last season.
2. What shold a preseason poll measure? Specifically, should it be a predictor of end-of-season standing (meaning that a team's schedule should be taken into account when determining a ranking), or should it merely be a barometer of talent/hype/expectations?
The preseason poll has to take schedule into account at least to some extent. If you believe two conference rivals are pretty even, the site of the game can be the deciding factor in ranking one team over another. However, schedule should not have a great influence over preseason rankings. For example, Florida will probably finish the season with more losses than Boise State thanks to a schedule that includes Tennessee, Alabama, LSU, Auburn, Georgia, South Carolina, and Florida State, but you'd be hard pressed to convince me Boise would beat them on a neutral field.
3. What is your biggest stretch in your preseason ballot? That is to say, which team has the best chance of making you look like an idiot for overrating them?
Iowa at #3 is definitely my biggest stretch. Being a numbers guy, I love their great point differential last season. With their poor showing in close games (0-3), a little regression (or progression) to the mean in the luck department along with the scheduling benefit of hosting Ohio State, I had to make them a top 5 team. However, I can foresee them losing to rival Iowa State, Ohio State, Michigan, and possibly one other road slip to finsih with a solid, but hardly top 5 8-4 record.
4. What do you see as the biggest flaw in the polling system (both wire service and blogpolling)? Is polling an integral part of the great game of college football, or is it an outdated system that needs to be replaced? If you say the latter, enlighten us with your new plan.
As with any voting system, the biggest problem is an uneducated electorate. Of course, I believe the blog poll is much more informed than the AP writers or coaches, I still don't think voters understand just how much influence random chance has over individual games. Because Team A beats Team B on a last second field goal, doesn't necessarily mean Team A is the superior squad. There is a lot of 'noise' that goes in to determining who wins and loses a football game. I think its important to look at other factors besides the final score, such as yardage, penalties, location, previous schedule, turnover differential, etc. to determine if the game was an accurate portrayal of both teams. I realize each of these aspects is highly subjective, but I think sometimes we put too much stock in the end result (final score) without considering the means with which that end was acheived.
5. You're Scott Bakula, and you have the opportunity to "Quantum Leap" back in time and change any single moment in your team's history. It can be a play on the field, a hiring decision, or your school's founders deciding to build the campus in Northern Indiana, of all godforsaken places. What do you do?
Well, being a Wake Forest fan, it would take much more than one single event to change the fortunes of our program (although I think we are in good hands under Jim Grobe), but the one thing I would change would be not firing Douglas 'Peahead' Walker after the 1950 season. I know it was a completely different era, but under Walker (1937-1950) our cumulative winning percentage was .597 (77-51-6). Maybe if he had stuck around in the second half of the century we would have a little better tradition.
On the whole, I like the poll, with the exception of the top two spots. So we're supposed to believe a team returning 2 starters on defense that must travel to Texas, Iowa, and Michigan State along with hosting Penn State and Michigan is the nation's top team? Yeah the offense should be bang up this season, but they're coached by Jim Tressel, so you know he's gonna play it close to the vest a time or two against the better teams on the schedule. I can see top 5, but #1 overall? And the 'Horns at #2? With the loss of Vince Young, who was the difference maker in games against Ohio State, USC, Texas A&M, and Oklahoma State, the Horns are a definite top 10 team as they have been for most of Mack Brown's tenure, but not the 2nd best team in the country. Without a player of Young's caliber, Texas could not have completed the stirring second half comeback over Oklahoma State last season.
2. What shold a preseason poll measure? Specifically, should it be a predictor of end-of-season standing (meaning that a team's schedule should be taken into account when determining a ranking), or should it merely be a barometer of talent/hype/expectations?
The preseason poll has to take schedule into account at least to some extent. If you believe two conference rivals are pretty even, the site of the game can be the deciding factor in ranking one team over another. However, schedule should not have a great influence over preseason rankings. For example, Florida will probably finish the season with more losses than Boise State thanks to a schedule that includes Tennessee, Alabama, LSU, Auburn, Georgia, South Carolina, and Florida State, but you'd be hard pressed to convince me Boise would beat them on a neutral field.
3. What is your biggest stretch in your preseason ballot? That is to say, which team has the best chance of making you look like an idiot for overrating them?
Iowa at #3 is definitely my biggest stretch. Being a numbers guy, I love their great point differential last season. With their poor showing in close games (0-3), a little regression (or progression) to the mean in the luck department along with the scheduling benefit of hosting Ohio State, I had to make them a top 5 team. However, I can foresee them losing to rival Iowa State, Ohio State, Michigan, and possibly one other road slip to finsih with a solid, but hardly top 5 8-4 record.
4. What do you see as the biggest flaw in the polling system (both wire service and blogpolling)? Is polling an integral part of the great game of college football, or is it an outdated system that needs to be replaced? If you say the latter, enlighten us with your new plan.
As with any voting system, the biggest problem is an uneducated electorate. Of course, I believe the blog poll is much more informed than the AP writers or coaches, I still don't think voters understand just how much influence random chance has over individual games. Because Team A beats Team B on a last second field goal, doesn't necessarily mean Team A is the superior squad. There is a lot of 'noise' that goes in to determining who wins and loses a football game. I think its important to look at other factors besides the final score, such as yardage, penalties, location, previous schedule, turnover differential, etc. to determine if the game was an accurate portrayal of both teams. I realize each of these aspects is highly subjective, but I think sometimes we put too much stock in the end result (final score) without considering the means with which that end was acheived.
5. You're Scott Bakula, and you have the opportunity to "Quantum Leap" back in time and change any single moment in your team's history. It can be a play on the field, a hiring decision, or your school's founders deciding to build the campus in Northern Indiana, of all godforsaken places. What do you do?
Well, being a Wake Forest fan, it would take much more than one single event to change the fortunes of our program (although I think we are in good hands under Jim Grobe), but the one thing I would change would be not firing Douglas 'Peahead' Walker after the 1950 season. I know it was a completely different era, but under Walker (1937-1950) our cumulative winning percentage was .597 (77-51-6). Maybe if he had stuck around in the second half of the century we would have a little better tradition.
Tuesday, August 15, 2006
Preseason Blog Poll
It's that time of year again. Children are going back to school, the days are slowly getting shorter, and the NFL is taunting its fans with preseason football. Its also time for predictions. Around this time of year, everyone is an expert, tossing around bold predictions and the like. I am no different, except that my predictions are here for all to read. That being said, here is my preseason Blog Poll Ballot. First a few things:
1) I ranked teams on how good I think they are, not what kind of record they will finish with
2) I really have no idea what I'm doing-- aside from believing USC will reload, Arkansas and Pitt will surprise, West Virginia and Notre Dame will disappoint, I really am not sure what to expect this season
3) Who is the 3rd best team in the Pac 10? In my opinion, USC and Cal are easly 1 and 2, but I have no idea what to expect from everyone else. Without further adieu, here's the ballot.
1. Southern Cal-- picking up where they left off
2. Auburn-- Kenny Irons, sleeper Heisman candidate?
3. Iowa-- solid point differential belied their mediocre record
4. Miami-- bowl loss a fluke
5. Texas-- I think they'll miss that Vince Young fellow
6. Ohio State-- offense will be good, but where's the D?
7. Louisville-- the other Bush will shine this year
8. Virginia Tech-- got a little feeling this could be similar to 2001-2003 when VT started out highly ranked and sank like a stone once the schedule toughened up
9. Georgia-- always seem to be in the top 10
10. Notre Dame-- be very wary of the Jackets on Labor Day weekend
11. Florida-- killer schedule
12. Cal-- big test opening up in Knoxville
13. Arkansas-- sleeper
14. Florida State-- bold prediction: won't lose 5 games this season
15. Pitt-- sleeper #2
16. Oklahoma-- not buying them as a legitimate national threat
17. Michigan-- also won't lose 5 games again
18. LSU-- Miles away from where they were under Saban
19. Clemson-- will they win 10 games? my man Frank says yes, I disagree
20. West Virginia-- sell, sell, sell
21. Utah-- best of the mids
22. Texas A&M-- time for a rebound
23. Purdue-- Joe Tiller won't go for consecutive losing seasons
24. Boise State-- fun to watch
25. Colorado-- will win the Big 12 North (again)
1) I ranked teams on how good I think they are, not what kind of record they will finish with
2) I really have no idea what I'm doing-- aside from believing USC will reload, Arkansas and Pitt will surprise, West Virginia and Notre Dame will disappoint, I really am not sure what to expect this season
3) Who is the 3rd best team in the Pac 10? In my opinion, USC and Cal are easly 1 and 2, but I have no idea what to expect from everyone else. Without further adieu, here's the ballot.
1. Southern Cal-- picking up where they left off
2. Auburn-- Kenny Irons, sleeper Heisman candidate?
3. Iowa-- solid point differential belied their mediocre record
4. Miami-- bowl loss a fluke
5. Texas-- I think they'll miss that Vince Young fellow
6. Ohio State-- offense will be good, but where's the D?
7. Louisville-- the other Bush will shine this year
8. Virginia Tech-- got a little feeling this could be similar to 2001-2003 when VT started out highly ranked and sank like a stone once the schedule toughened up
9. Georgia-- always seem to be in the top 10
10. Notre Dame-- be very wary of the Jackets on Labor Day weekend
11. Florida-- killer schedule
12. Cal-- big test opening up in Knoxville
13. Arkansas-- sleeper
14. Florida State-- bold prediction: won't lose 5 games this season
15. Pitt-- sleeper #2
16. Oklahoma-- not buying them as a legitimate national threat
17. Michigan-- also won't lose 5 games again
18. LSU-- Miles away from where they were under Saban
19. Clemson-- will they win 10 games? my man Frank says yes, I disagree
20. West Virginia-- sell, sell, sell
21. Utah-- best of the mids
22. Texas A&M-- time for a rebound
23. Purdue-- Joe Tiller won't go for consecutive losing seasons
24. Boise State-- fun to watch
25. Colorado-- will win the Big 12 North (again)
Saturday, August 12, 2006
The Worst BCS Bowl Teams
With the addition of an extra BCS game this season, the chance that an undeserving school sneaks into the BCS has just increased by roughly 25%. With that in mind, I decided to take a look back to see which teams were the worst to ever play in a BCS bowl game. In my opinion, there are four teams that were truly undeserving of their BCS invitation. The countdown...
#4
Purdue 2000
Record: 8-3
Pt Differential: +125
Pythagorean Record: 8.09-2.91
Record Vs Teams with Winning Records: 4-1
Record in Close (8 pts or less) Games: 3-2
Road Record: 2-3
opponent's Record: 65-64 .504
Purdue won the Big 10 in 2000 with a 6-2 conference record. They managed to defeat their closest competitors in the standings (Michigan, Northwestern, and Ohio State), but slipped at Penn State (5-7) in the first year of their recent slide and Michigan State (5-6). Besides their loss to Notre Dame (9-3), their non-conference slate was softer than Bonecrusher's midsection with wins against hapless MAC squads Central Michigan (2-9) and Kent State (1-10).
#3
Syracuse 1998
Record: 8-3
Pt Differential: +199
Pythagorean Record: 8.67-2.33
Record Vs Teams with Winning Records: 3-3
Record in Close (8 pts or less) Games: 1-2
Road Record: 2-2
opponent's Record: 71-58 .550
Donovan McNabb's senior season at Syracuse was very weird. The team opened up with a one point defeat to eventual national champion Tennessee in the Carrier Dome. They followed that up with a win over Michigan (10-3) in Ann Arbor. After a breather against Rutgers (5-6) the Orange got run out of Raleigh by a mediocre Wolfpack team (7-5) by 21 points. They followed that up with three wins over teams with 2, 4, and 2 wins respectively. Then they lost a close game to a solid West Virginia squad (8-4). After that something clicked as the Orange sandwiched a shellacking of Temple (2-9) around a hard fought victory over Virginia Tech (9-3) and a 53 point beat down of Miami (9-3). However, Syracuse earns a place on this list because the Big East as a whole was down in 1998 with no dominant teams emerging, and because they beat three teams with only two wins (Temple, Cincinnati, and Pittsburgh).
#2
Pittsburgh 2004
Record: 8-3
Pt Differential: +65
Pythagorean Record: 6.95-4.05
Record Vs Teams with Winning Records: 2-1
Record in Close (8 pts or less) Games: 5-2
Road Record: 3-2
opponent's Record: 56-59 .487
Everybody remembers Walt Harris' final Pittsburgh team. They won the extremely watered down Big East and were the sacrifice at the altar of the mid majors against Utah in the Fiesta Bowl. Truly, in the land of the blind, the one-eyed man is king. The Panthers played three teams with winning records, losing to Connecticut (8-4) and knocking off their biggest Big East challengers Boston College (9-3) and West Virginia (8-4). In non-conference action they lost to the worst Nebraska team in recent memory (5-6) and barely squeaked by Division IAA Furman by 3 points.
#1
Stanford 1999
Record: 8-3
Pt Differential: +62
Pythagorean Record: 6.56-4.44
Record Vs Teams with Winning Records: 1-2
Record in Close (8 pts or less) Games: 3-2
Road Record: 3-2
opponent's Record: 60-70 .462
Narrowly edging out the Pitt Panthers for the top spot. Tyrone Willingham's 1999 Stanford Cardinal played three teams with winning records in a very down year for the Pac 10. They beat Oregon State (7-5) and lost to Washington (7-5) in conference. The scheduling gods allowed them to avoid the Pac 10's best team Oregon (9-3). In non-conference action, a solid but not great Texas team (9-5) stomped them by 52 points. The game that seals Stanford's place in this pantheon is their non-conference loss at home to San Jose State (3-7) a WAC school whose other wins that season were over Tulsa (2-9) and St. Mary's (non-Division IA).
That's my take. What's yours?
Tuesday, August 08, 2006
Consistent Part Tres
After examining consistency in the Pac 10 and Big 12, it's high time we delve into the SEC. In the past 10 seasons (1996-2005) the SEC has produced of the 12 national champions. Ironically, two of the champions (Florida in 1996 and LSU in 2003) finished the season with a loss, while Auburn finished undefeated in 2004, yet was not able to play for the national championship. Here are the 12 teams ranked by standard deviation of seasonal winning percentage from most consistent to least consistent.
Vanderbilt .1141
Florida .1147
Georgia .1306
Tennessee .1470
Arkansas .1483
Mississippi .1511
Kentucky .1605
Auburn .1934
Alabama .2089
LSU .2111
Mississippi State .2285
South Carolina .2372
The 'Dores are the most consistent team in the SEC from the past decade never winning more than 5 games nor fewer than 2. The top 4 consistent teams in the SEC are from the East. Vanderbilt consistently finishes at the bottom and the Big 3 of Georgia, Florida, and Tennessee consistently finish st the top. However, the most inconsistent team in the SEC also comes from the Eastern Division. In the past decade South Carolina has truly been everywhere. In 1999, they won no games and just two seasons later they went 9-3.
Vanderbilt .1141
Florida .1147
Georgia .1306
Tennessee .1470
Arkansas .1483
Mississippi .1511
Kentucky .1605
Auburn .1934
Alabama .2089
LSU .2111
Mississippi State .2285
South Carolina .2372
The 'Dores are the most consistent team in the SEC from the past decade never winning more than 5 games nor fewer than 2. The top 4 consistent teams in the SEC are from the East. Vanderbilt consistently finishes at the bottom and the Big 3 of Georgia, Florida, and Tennessee consistently finish st the top. However, the most inconsistent team in the SEC also comes from the Eastern Division. In the past decade South Carolina has truly been everywhere. In 1999, they won no games and just two seasons later they went 9-3.
Friday, July 28, 2006
Bowl Games and the Spread
 Look at my greasy hair.
 As promised last week for all you degenerates, here are the results for how certain team characteristics predict bowl winners against the spread. If you don't feel like reading the last post, here's a quick refresher. The sample size is every bowl game from the past 6 seasons (2000-2005). I determined how often the team with the better overall record, point differential, conference record, offense (rated by points scored) and defense (rated by points allowed) won the bowl game against the spread. In the interest of staving off premature blindness and causing confusion, I will eschew year by year results and just hit you with the cumulative data.
Better Record: 62-62-3 .500
Better Point Differential: 69-87-3 .443
Better Conference Record: 47-63-3 .429
Better Offense: 64-93-3 .409
Better Defense: 75-81-3 .481
Nothing. Zilch. Nada. Neither characteristic predicts bowl spread coverers (for lack of a better term) with any accuracy. Looks like Vegas wins again. But wait. When you dig a little deeper and separate each category into underdogs and favorites something does show up.
Better Record
Dog: 28-40 .412
Favorite: 34-22-3 .602
Better Point Differential
Dog: 21-64 .247
Favorite: 48-23-3 .669
Better Conference Record
Dog: 24-36 .400
Favorite: 23-27-3 .462
Better Offense
Dog: 24-62 .279
Favorite: 40-31-3 .561
Better Defense
Dog: 30-55 .353
Favorite: 45-26-3 .628
For the most part, in every category except better conference record, underdogs perform very poorly, but favorites perform quite well. Why is this so? I can't really come up with any ideas off the cuff, but the phenomenon does seem to exist. So if hypothetically, the Sun Bowl matches up two teams, and the team with the better record (or point differential, or offense, or defense) is also the favorite, they might be a good play. Of course, past performance is no guarantee of future performance, but if you do use this knowledge to win a substantial, any donations will be accepted.
Monday, July 24, 2006
Bowl Winners Addendum
I am just curious: for the bowls with teams with the same record, what is the winning % of that sub-category based on Better Point Differential, Better Offense, and Better Defense?
-ArmchairGM user
Ask and you shall receive.
When bowl teams have the same record the winning percentages for each category are as follows:
Better Point Differential: 14-20 .412
Better Conference Record: 8-10 .444
Better Offense: 14-20 .412
Better Defense: 21-13 .618
When teams have the same overall record, better defense remains a good predictor of bowl winners (actually increasing from .581 when overall record is discounted). However, the other three measures all decline in their ability to pick winners, especially point differential and better offense. I wouldn't draw any dramatic conclusions from this because the sample size is quite small. What do you think?
-ArmchairGM user
Ask and you shall receive.
When bowl teams have the same record the winning percentages for each category are as follows:
Better Point Differential: 14-20 .412
Better Conference Record: 8-10 .444
Better Offense: 14-20 .412
Better Defense: 21-13 .618
When teams have the same overall record, better defense remains a good predictor of bowl winners (actually increasing from .581 when overall record is discounted). However, the other three measures all decline in their ability to pick winners, especially point differential and better offense. I wouldn't draw any dramatic conclusions from this because the sample size is quite small. What do you think?
Friday, July 21, 2006
Predicting the Winners of College Bowl Games

Ever notice how bowl games seem to be such crap shoots? Take for example the case of the Cal Golden Bears circa 2004. They roll through the regular season with a 10-1 record losing only to eventual national champion USC by 6 points in Los Angeles. Besides USC, the only other close game they played was against Oregon, whom they beat by a single point. They throttled everyone else. Then in the Holiday Bowl against Texas Tech, a mediocre 7-4 team who lost to New Mexico, they get beat by 14 in a game that was not that close. Or how about 2005, when a 9-2 Auburn team whose only setback since Labor Day was a 3 point loss at Death Valley against LSU. In the Capital One Bowl against a 9-3 Wisconsin team that lose to Iowa (7-5) and Northwestern (7-5) and needed a miracle blocked punt to beat Minnesota (7-5) they manage only 10 points and lose 24-10. Is this a common refrain or do bowl games follow some sort of pattern in their results. To find out I examined every college bowl game from the 2000-2001 bowl season to the recently completed 2005-2006 bowl season. I included 5 categories in the study. I looked at how often the team with the better overall record, better point differential, better conference record, better offense (points per game), and better defense (points allowed per game) pre bowl won the game. Here are the results for each season.
2000-01
Better Record: 15-6 (4 bowls matched teams with the same record) .714
Better Point Differential: 14-11 .560
Better Conference Record: 10-6 (9 with same record or Independent teams) .625
Better Offense: 15-10 .600
Better Defense: 13-12 .520
2001-02
Better Record: 13-12 .520
Better Point Differential: 16-9 .640
Better Conference Record: 9-11 (5 with same record or Independent teams) .450
Better Offense: 13-12 .520
Better Defense: 15-10 .600
2002-03
Better Record: 14-11 (3 bowls matched teams with the same record) .560
Better Point Differential: 15-13 .536
Better Conference Record: 9-10 (9 with same record or Independent teams) .474
Better Offense: 13-15 .464
Better Defense: 15-12 (1 bowl matched teams with the same average point allowed) .556
2003-04
Better Record: 14-8 (6 bowls matched teams with the same record) .636
Better Point Differential: 17-11 .607
Better Conference Record: 9-11 (8 with same record or Independent teams) .450
Better Offense: 13-15 .464
Better Defense: 18-10 .643
2004-05
Better Record: 9-7 (12 bowls matched teams with the same record) .563
Better Point Differential: 16-12 .571
Better Conference Record: 10-9 (9 with same record or Independent teams) .526
Better Offense: 14-14 .500
Better Defense: 16-12 .571
2005-06
Better Record: 11-7 (9 bowls matched teams with the same record) .611
Better Point Differential: 14-12 (1 bowl matched teams with same point differential) .538
Better Conference Record: 6-13 (8 with same record or Independent teams) .316
Better Offense: 13-14 .481
Better Defense: 16-11 .593
Total:
Better Record: 76-51 (34 bowls matched teams with the same record) .598
Better Point Differential: 92-68 (1 bowl matched teams with same point differential) .575
Better Conference Record: 53-60 (48 with same record or Independent teams) .469
Better Offense: 81-80 .503
Better Defense: 93-67 (1 bowl matched teams with the same average point allowed) .581
A few things. Its amazing how consistent most of these measures are. With the exception of 2000-01, the better offense has alternated winning slightly more than half and slightly less than half the time. The better record has been either the best predictor or second best predictor every year except for one (2001-02). It appears the bowl upsets mentioned above are relatively rare. The team with the superior record wins almost 60% of the time. These upsets simply stick out in our minds more so than the games that play out like we expect. If you're predicting bowl games, and the teams have the same record, err on the side of the better defense or the team with the better point differential. If you go with the better offense, you might as well flip a coin. If you go by better conference record, then your the guy book makers love. Speaking of which, look for a post next week analyzing the same thing, but this time looking at how bowl games play out against the spread.
Saturday, July 15, 2006
Revisiting 2001: A Seasonal Odyssey

Journey with me to the 2001 college football season. Oh how things were different just 5 short years ago. USC was beginning a new era under NFL failure Pete Carroll, Mack Brown still couldn't beat Oklahoma, Florida State had yet to finish outside the top 10 in 2 decades. Heading into Thanksgiving weekend, it looked as if the Rose Bowl's first turn to host the BCS title game would be a historical rematch of Miami versus Nebraska. Then all hell broke loose. Colorado thumped Nebraska by 26 points on the Friday after Thanksgiving. That opened the door for several one-loss teams to step up and assume the #2 ranking in the BCS. The very next day Oklahoma (10-1) was upset by archrival Oklahoma State (4-7). That loss coupled with their earlier loss to Nebraska enabled Texas put Texas into the Big 12 Championship Game. The next weekend, two more one-loss teams would play what amounted to an elimination game in the swamp. Florida (9-1) would host Tennessee (9-1) in an early season game that was postponed thanks to September 11th. Tennessee upset the Gators and looked to be in control of their own destiny heading into the SEC Championship game the next week against LSU. On the same day, Oregon (10-1) quietly concluded a superb regular season by squeaking by archrival Oregon State (5-6). On Championship Saturday, two more one-loss teams went down. Texas was upset by a Colorado team they had throttled by 34 points 6 weeks earlier in the Big 12 Championship Game. Tennessee was also upset in their title game by LSU. This left the BCS standings in absolute chaos. When the dust cleared, a team that didn't even win its half of the conference, would face Miami in the grand-daddy of them all for the national championship. Nebraska edged Colorado by five hundredths of a point (7.23 to 7.28) for second place. Oregon was a distant fourth at 8.67. So who deserved to play Miami for the national title? Determining who deserved to play Miami is not easy. Historically teams that play for the national title cannot have more than 1 loss. That limits the possibilities. Instead I will try to determine which team was the second best in the nation in 2001, not necessarily who deserved to play Miami. In my opinion, there were 12 candidates, some of them much more legitimate than others. We'll start with the best of the non-BCS teams, then examine the BCS pretenders, and finally examine the legitimate BCS contenders. Under each team 8 pre-bowl game statistics are listed: their record (conference record in parentheses), number of points scored and allowed, point differential, Pythagorean record, record in close games (those decided by 8 points or less), record against winning teams, road record, and finally opponent's cumulative winning percentage. This is all followed by a brief synopsis of their season summing up their case to play Miami.
Non-BCS
BYU
Record: 12-1 (7-0)
Points Scored Points Allowed: 608 396
Point Differential: +212
Pythagorean: 9.54-3.46
Close Games: 5-0
Winning Records: 3-1
Road Games: 6-1
Opp Win%: .399 (59-89)
I left them out of the discussion earlier, but the Mountain West champion Cougars were actually undefeated heading into their season finale against at Hawaii on December 8th. Prior to the showdown with Hawaii (who finished 9-3), some BYU administrators had publicly contemplated suing the BCS if an undefeated Cougar squad were left out. After the game, such talk was moot. BYU scored 45 points which is good. However, they allowed 72 which isn't so good. In that game, Hawaii quarterback Nick Rolovich threw more touchdown passes (8) than Heisman winning quarterback Eric Crouch (7) had thrown all season. It was fitting BYU lost their final contest by such a large margin against the best team they would play in the regular season. They played a ridiculously easy schedule, and struggled to put away some bad teams. They beat UNLV (4-7) by 4, New Mexico (6-5) by 4, Wyoming (2-9) by 7, and Mississippi State (3-8) by 3. Their best win was over Utah (8-4). A BCS appearance by BYU would have likely been both a blowout and most undeserved.
Fresno State
Record: 11-2 (6-2)
Points Scored Points Allowed: 525 300
Point Differential: +225
Pythagorean: 10.27-2.73
Close Games: 2-2
Winning Record: 4-2
Road Games: 6-1
Opp Win %: (.489) 74-78
The Bulldogs weren't really a contender for the #2 spot in the BCS rankings, but I left them on here for 2 reasons. Foremost, they beat a team we'll discuss later, Colorado, in the Jim Thorpe Classic during the season's first weekend. Secondly, they were probably the best non-BCS team in 2001. Although the Bulldogs did defeat 3 BCS teams in 2001, 2 of those teams were having down years (Oregon State finished 5-6 and Wisconsin finished 5-7). Still give Pat Hill credit for his scheduling cajones. Unfortunately, 2 late October losses to Boise State and Hawaii prevented Fresno from even winning the WAC. Still, its fun to play the what-if game. What if Fresno managed to knock off those 2 teams and stood as the only other undefeated team besides Miami when the regular season ended? Would there victory over the Buffaloes allow them to jump both Nebraska and Colorado or would their weak schedule do them in?
BCS Pretenders
Maryland
Record: 10-1 (7-1)
Points Scored Points Allowed: 390 210
Point Differential: +180
Pythagorean: 8.94-2.06
Close Games: 3-0
Winning Record: 6-1
Road Games: 3-1
Opp Win %: .473 (61-68)
Under rookie head Ralph Friedgen, the Terraphins doubled their win total and won the ACC outright. Their success was the product of a down ACC (every other team had at least 4 total losses), some good luck in close games (3-0), and the victories by North Carolina and NC State over perennial league champion Florida State. The Terps were handled by 21 in Tallahassee, but did not stumble again in ACC play. The Seminoles on the other hand lost to both the Heels (in a stunning 41-9 rout) and the Pack. Maryland was a good team in 2001, but nowhere near elite status.
Illinois
Record: 10-1 (7-1)
Points Scored Points Allowed: 356 238
Point Differential: +118
Pythagorean: 7.94-3.06
Close Games: 4-0
Winning Record: 3-1
Road Games: 4-1
Opp Win %: .488 (62-65)
Aside from the fact that their head coach was not in his first season, the Illini owe much of their success to the same factors as Maryland. A down Big 10 (no other team had fewer than 4 losses), some good luck in close games (4-0), and some upsets over the league's best team helped the Illini capture the Big 10 crown. After being handled by the Michigan Wolverines in late September 45-20, the Illini looked to be playing for second place. However, the Wolverines lost to Michigan State by 2 in early November, and followed that up with a loss to Ohio State at the end of the month by 6. Illinois kept winning and took the Big 10 title outright. Like Maryland, they were good, but not elite.
LSU
Record: 9-3 (5-3)
Points Scored Points Allowed: 371 268
Point Differential: +103
Pythagorean: 8.20-3.80
Close Games: 2-1
Winning Record: 4-3
Road Games: 3-1
Opp Win %: .567 (80-61)
Despite 3 conference losses, the Tigers won the SEC by upseting Tennessee in the championship game. Clearly not the best team in the conference, they lost at home to Florida by 29 points.
Colorado
Record: 10-2 (7-1)
Points Scored Points Allowed: 396 280
Point Differential: +116
Pythagorean: 8.33-3.67
Close Games: 2-1
Winning Record: 5-2
Road Games: 3-1
Opp Win %: .589 (86-60)
Despite the fact that they won the Big12, Colorado was not the best team in the conference, and definitely not the second best team in the nation. Before upsetting Texas in the Big 12 Championship Game, they had lost to the Longhorns by 34 points. In 4 of the 6 BCS conferences, the best team clearly did not win (ACC, Big 10, Big 12, SEC).
BCS Contenders
Oregon
Record: 10-1 (7-1)
Points Scored Points Allowed: 374 240
Point Differential: +134
Pythagorean: 8.15-2.85
Close Games: 5-1
Winning Record: 3-1
Road Games: 5-0
Opp Win %: .508 (64-62)
Finally a deserving BCS champion. The Ducks did have some good luck in close games (5-1), but were clearly the best team in the Pac 10. Still, their point differential was not that great and their schedule strength was pretty weak. I'm not including the bowl game because this writing is intended to be a summation of the regular season. However, they did trounce Colorado by in the Fiesta Bowl.
Nebraska
Record: 11-1 (7-1)
Points Scored Points Allowed: 449 189
Point Differential: +260
Pythagorean: 10.63-1.37
Close Games: 0-0
Winning Record: 5-1
Road Games: 3-1
Opp Win %: .546 (77-64)
Ah the team that started this whole mess. Before their loss to Colorado, this looked like the Nebraska of old. They hadn't really been challenged except by Oklahoma in a game they eventually won by 10 points. Of course, besides Oklahoma, the best team they had played prior to Colorado was either Iowa State (7-5) or Texas Tech (7-5). That coupled with the Colorado curb-stomping keeps prevents them from landing the #2 slot.
Oklahoma
Record: 10-2 (6-2)
Points Scored Points Allowed: 387 166
Point Differential: +221
Pythagorean: 10.58-1.42
Close Games: 1-1
Winning Record: 4-1
Road Games: 3-1
Opp Win %: .510 (73-70)
The defending champs had their chance until an unthinkable slip up at home against Oklahoma State. Oklahoma had a solid point differential and defeated Texas, but the slip up to a team as bad as Oklahoma State seals the argument against them. Those Cowboys finished 4-7 and their other victories were over Louisiana Tech (7-5), Baylor (3-8) and non-Division IA Northwestern State.
Texas
Record: 10-2 (7-1)
Points Scored Points Allowed: 470 164
Point Differential: +306
Pythagorean: 11.09-0.91
Close Games: 0-1
Winning Record: 4-2
Road Games: 5-0
Opp Win %: .510 (73-70)
The beneficiary of Oklahoma State's upset over Oklahoma. The irony in everything is that Texas was likely headed for a BCS bowl if Oklahoma hadn't been upset. Instead they got a rematch with a Colorado team that previously beaten by 34 in the Big12 Championship. A win there could have propelled them to the Rose Bowl. However, the upset loss relegated them to the Holiday Bowl. A very good point differential keep them in the conversation despite the upset by Colorado.
Tennessee
Record: 10-2 (7-1)
Points Scored Points Allowed: 355 234
Point Differential: +121
Pythagorean: 8.74-3.26
Close Games: 4-1
Winning Record: 6-2
Road Games: 5-0
Opp Win %: .594 (85-58)
Before their loss to LSU, the Vols only blemish was to Georgia by 2 points. That was the only close game the Vols would lose. They scraped by LSU the first time by 8, beat South Carolina (9-3) by 7, beat Kentucky (2-9) by 2, and narrowly escaped Florida in the Swamp by 2. The Vols are a solid candidate, but their relatively small point differential keeps them out of the #2 slot.
Florida
Record: 9-2 (6-2)
Points Scored Points Allowed: 482 155
Point Differential: +327
Pythagorean: 10.3-0.70
Close Games: 0-2
Winning Record: 5-2
Road Games: 3-1
Opp Win %: .557 (73-58)
Florida was good in 2001, very good. In Steve Spurrier's final season they whipped Marshall (11-2) by 35. They won at LSU by 29. They won at South Carolina (9-3) by 37. They beat Florida State (8-4) by 24. Unfortunately, the bounces in close games did not go their way. They lost to Auburn (7-5) by 3 and to Tennessee by 2. 5 points separated Florida from an undefeated season. Despite their 2 losses, in my opinion Florida was the second best team in 2001. They had the highest point differential of any team besides Miami, they played a tough schedule and dominated several good teams, and their losses were close games to good team. Would they have beaten Miami in the 2001 Rose Bowl? Probably not, Miami was on another level in 2001, but Florida had the best chance of any other team.
Thursday, July 13, 2006
It's How You Finish

How important is ending the season on a winning note? It seems logical that teams that finish the season strong would have momentum in recruiting and a general good vibe among their fans for the following season. These factors combined with the standard maturity of college athletes after another semetser at school should equate to marked improvement for the team the following season. But is this logical progression true? Let's find out. To answer this question, I looked at how each BCS conference team finished the season in 2002, 2003, and 2004. I then looked at their record the following season (2003, 2004, 2005). To define finishing the season, I used each game played on or after November 1st. For most teams this was a sample of between 3-6 games. Of course better teams play more games after November 1st thanks to bowl games and conference championships. I then ran a regression analysis to determine how well the winning percentage in these closing games predicted each teams winning percentage the following year. Here are the R squared values for each of the three seasons.
End of 2002 Predicting 2003: .3432
End of 2003 Predicting 2004: .2976
End of 2004 Predicting 2005: .1445
There seems to be something to this logic. The way a team finishes the season does have at least a limited impact on their performance the following year. Is there a better way to judge how a team finishes a season? In order to access whether there is, I will run the same analysis, but instead use net points instead of winning percentage to predict the subsequent season's winning percentage. Net points are simply the amount of points a team has scored more or less than their opponents. A positive differential indicates the team in question has outscored their opponents, while a negative differential means they have been outscored. For example, if a team goes 3-1 from November first onward they have a winning percentage of .750. However, if their 3 wins are by 7, 3, and 4 points, and their loss is an annihilation by 40 points, then their net point total is -26.
End Net Points 2002 Predicting 2003: .3297
End Net Points 2003 Predicting 2004: .3256
End Net Points 2004 Predicting 2005: .2515
Again their appears to be at least a marginal relationship between a team's closing net points and their winning percentage the following year. This relationship is much more consistent than actual won/loss record in the season's final few games. Further validation that teams are a function of their points scored and allowed more than their won/loss record. However, the effect of finishing a season strong should not be overstated. As noted in an earlier post, a team's record for the entire year and Pythagorean record for the whole year are better predictors of their record the following year (at least for 2004-2005).
Friday, July 07, 2006
The Best Losing Team of the Past Decade
 A few weeks ago I analyzed the worst 10 win teams since 1995. Now I want to do the opposite or something like that. What were the beast teams with losing records during the same time span? Here are my best guesses. Under each team, 6 characteristics will be listed: their record, their point differential, their Pythagorean record, their record in close games, their record against teams with winning records, and their opponent’s winning percentage.
 Purdue 1995
Record: 4-6-1
Point Differential: +13
Pythag: 5.81-5.29
Close Games: 1-4-1
Winning Records: 1-5-1
Opp Win %: .593 (75-51-3)
1995 was Jim Colletto’s penultimate season in
Record: 5-6
Point Differential: +43
Pythag: 6.69-4.31
Close Games: 0-3
Winning Records: 0-5
Opp Win %: .472 (58-65-2)
One of the close losses suffered by the West Virginia Mountaineers was to the aforementioned Purdue Boilermakers on Labor Day Weekend by a 26-24 score. Although
UCLA 1996
Record: 5-6
Point Differential: +12
Pythag: 5.74-5.26
Close Games: 1-2
Winning Records: 1-5
Opp Win %: .609 (78-50)
The Bruins went 4-4 in the Pac 10 in 1996, but thanks to their non-conference schedule, finished out of the bowl picture. Two of their three non-conference games were road showdowns against
Alabama
Record: 4-7
Point Differential: -2
Pythag: 5.45-5.55
Close Games: 0-4
Winning Records: 2-5
Opp Win %: .609 (78-50)
The Crimson Tide began the year 4-3, but lost their final four contests to finish 4-7 in Mike Dubose’s inaugural season. Their last 4 games were against Louisiana Tech (9-2),
Colorado
Record: 5-6
Point Differential: +5
Pythag: 5.61-5.39
Close Games: 2-3
Winning Records: 2-6
Opp Win %: .662 (88-45)
Central Florida
Record: 5-6
Point Differential: +71
Pythag: 6.84-416
Close Games: 0-4
Winning Records: 1-4
Opp Win %: .590 (69-48)
In just their second season of Division IA football,
LSU 1998
Record: 4-7
Point Differential: +58
Pythag: 6.71-4.29
Close Games: 0-5
Winning Records: 2-7
Opp Win %: .621 (82-50)
Fresh off a 9-3 season that culminated with an Independence Bowl win over Notre Dame, great things were expected for the LSU Tigers. LSU began the season 3-0, but would only win one of their final 8 contests. Lady Luck was not on their side. 5 of their 7 losses were by a combined 19 points. Their schedule was also very difficult as they faced 5 teams with at least 9 wins. Unlike most of the other teams on this list, LSU did not improve the following year. They fell even farther to 3-8 and Gerry DiNardo was given his walking papers.
Oklahoma
Record: 5-6
Point Differential: +7
Pythag: 5.65-5.35
Close Games: 0-3
Winning Records: 1-5
Opp Win %: .545 (72-60)
Coming off an 8-4 season and an appearance in the Alamo Bowl the Pokes looked to be in fine shape under head coach Bob Simmons. Entering his fourth season, Simmons had improved the Cowboys record each season during his tenure. Coupled with returning quarterback Tony Lindsay who had taken the helm the previous season as a freshman and the Cowboys looked to be well on their way to a successful season. However, a 2-4 start doomed the Pokes to a losing season. The main difference in their booming 1997 campaign and the disappointing 1998 season was the schedule. In 1997 they avoided Big 12 North heavyweights
Auburn 1999
Record: 5-6
Point Differential: -3
Pythag: 5.42-5.58
Close Games: 2-2
Winning Records: 2-6
Opp Win %: .639 (76-43)
In 1998, the Auburn Tigers had almost as many coaches (2) as wins (3). 1999 marked the maiden voyage of former
Notre Dame 1999
Record: 5-7
Point Differential: +17
Pythag: 6.36-5.64
Close Games: 3-4
Winning Records: 1-6
Opp Win %: .601 (86-57)
1999 was a year of streaks for the Fighting Irish. After opening the season with a blowout of
Arizona 2000
Record: 5-6
Point Differential: +17
Pythag: 5.95-5.05
Close Games: 1-3
Winning Records: 0-4
Opp Win %: .570 (73-55)
After beginning the season 5-1, the Wildcats lost their final 5 games. Three of those games were against
Colorado 2000
Record: 3-8
Point Differential: -32
Pythag: 4.73-6.27
Close Games: 1-6
Winning Records: 1-6
Opp Win %: .626 (82-49)
Utah 2000
Record: 4-7
Point Differential: +27
Pythag: 6.29-4.71
Close Games: 0-4
Winning Records: 1-2
Opp Win %: .465 (59-68)
Before
Arizona State 2001
Record: 4-7
Point Differential: +13
Pythag: 5.73-5.27
Close Games: 0-1
Winning Records: 0-5
Opp Win %: .551 (70-57)
Oregon State 2001
Record: 5-6
Point Differential: +28
Pythag: 6.17-4.83
Close Games: 1-3
Winning Records: 1-4
Opp Win %: .576 (78-50)
After their 11-1 2000 season that included a thrashing of Notre Dame in the Fiesta Bowl, the Beavers were saddled with great expectations. Sports Illustrated even ranked them number 1 in their preview issue. It took only one week for those dreams to be dashed. In the first game of the season, the Beavers were ambushed in
Illinois 2002
Record: 5-7
Point Differential: +39
Pythag: 6.84-5.16
Close Games: 2-3
Winning Records: 2-5
Opp Win %: .555 (86-69)
After a surprise Big 10 championship in 2001, Ron Turner’s Illini fell on some hard luck in 2002. If you’ll remember, the 2001 incarnation if the Illini was on the worst 10-win teams of the last decade list, so this year’s version really wasn’t dramatically worse, just a lot less lucky. The Illini began the season 1-5 before rebounding to win 4 of their last 6 to finish strong. However, the bottom fell out in 2003 as the Illini slumped to 1-11.
Alabama 2003
Record: 4-9
Point Differential: -2
Pythag: 6.45-6.55
Close Games: 0-6
Winning Records: 2-9
Opp Win %: .679 (114-54)
The Crimson Tide had an unbelievable difficult schedule in 2003. They played 11 teams with winning records, and amazingly almost have the teams they played (6) won at least 10 games. The Tide were also agonizingly close in most of their losses as well, going 0-6 in close games.
Arkansas 2004
Record: 5-6
Point Differential: +58
Pythag: 6.75-4.25
Close Games: 1-3
Winning Records: 0-6
Opp Win %: .617 (79-49)
The Hogs suffered their first losing season under head coach Houston Nutt. They were certainly capable of playing with the big boys, at least at home. They lost by 2 to
Kansas 2004
Record: 4-7
Point Differential: +27
Pythag: 6.20-4.80
Close Games: 1-5
Winning Records: 1-6
Opp Win %: .598 (79-53)
Despite the fact that they finished 4-7, 2004 was still a historic year for the Jayhawks. They beat in-state rival
NC State 2004
Record: 5-6
Point Differential: +46
Pythag: 6.73-4.276
Close Games: 2-4
Winning Records: 1-5
Opp Win %: .564 (66-51)
The first year of the post-Phillip Rivers era resulted in Chuck Amato’s first losing season as a head coach. The Pack went from scoring over 37 points per game to a mere 24 per game. Aside from the narrow victory over Virginia Tech, the Pack could not break through against good teams either, posting a 1-5 record against winning teams. Despite an even poorer performance from the offense in 2005, the pack improved to 7-5.
Arkansas 2005
Record: 4-7
Point Differential: +12
Pythag: 5.78-5.22
Close Games: 0-4
Winning Records: 0-6
Opp Win %: .630 (75-44)
The Hogs make the list two seasons in a row. In the last two years
Connecticut 2005
Record: 5-6
Point Differential: +61
Pythag: 7.11-3.89
Close Games: 1-1
Winning Records: 0-4
Opp Win %: .478 (55-60)
After a successful initial season in the Big East in 2004, the Huskies nearly fell to the bottom of the league in 2005. Like
Pittsburgh 2005
Record: 5-6
Point Differential: +24
Pythag: 6.11-4.89
Close Games: 0-3
Winning Records: 0-5
Opp Win %: .552 (64-52)
2005 was a banner year for
Washington State 2005
Record: 4-7
Point Differential: +22
Pythag: 5.90-5.10
Close Games: 1-5
Winning Records: 1-5
Opp Win %: .598 (70-47)
Hard luck does not begin to describe the Cougars season in 2005. Not only did they finish 1-5 in close games, those 5 losses occurred in a span of 6 weeks. Despite the best efforts of Jerome Harrison (1900 rushing yards)
Here’s the tail of the tape. Below is the best of each team in each category (or worst in terms of close games which indicate a fair amount of luck).
Point Differential: +71;
Pythag: 7.11-3.89; Connecticut 2005
Close Games: 0-6; Alabama 2003
Winning Record: 2-9; Alabama 2003
Opp Win%: .679 (114-54); Alabama 2003
So who is the best of the losing teams? I have to say
Sunday, July 02, 2006
Consistent Part Deux
About a month ago I blogged about consistency in the Big 12 conference. Now I'm going to examine consistency in the Pac 10 for the same time span (1996-2005). Amazingly in that 10 season span, every team in the Pac 10 has won at least 10 games (or won the conference) and had a losing season. If Karl Marx and Friedrich Engels were alive today and football fans, they would surely enjoy Pac 10 football. Here are the 10 teams ranked by standard deviation of seasonal winning percentage from most consistent to least consistent.
Oregon .1528
Stanford .1741
Arizona State .1742
UCLA .1767
Oregon State .2032
Arizona .2109
California .2178
Southern Cal .2203
Washington State .2379
Washington .2479
The Ducks rate as the most consistent team of the past 10 years. However, their standard deviation would only rate as the 7th most consistent if they played in the Big 12. In one of sports nice little coincidences, the Ducks won 6 games in 1996 and increased their win total by exactly one game until 2001 when they peaked with 11 wins. The Huskies of Washington rate as the least consistent having gone from perennial contender in the late 90's to doormat the last two seasons. Southern Cal may be a heavy favorite to win their fifth consecutive conference title, but if the Pac 10 has been anything in the past decade, its anything but predictable.
Oregon .1528
Stanford .1741
Arizona State .1742
UCLA .1767
Oregon State .2032
Arizona .2109
California .2178
Southern Cal .2203
Washington State .2379
Washington .2479
The Ducks rate as the most consistent team of the past 10 years. However, their standard deviation would only rate as the 7th most consistent if they played in the Big 12. In one of sports nice little coincidences, the Ducks won 6 games in 1996 and increased their win total by exactly one game until 2001 when they peaked with 11 wins. The Huskies of Washington rate as the least consistent having gone from perennial contender in the late 90's to doormat the last two seasons. Southern Cal may be a heavy favorite to win their fifth consecutive conference title, but if the Pac 10 has been anything in the past decade, its anything but predictable.
Friday, June 30, 2006
The Measure of a Man
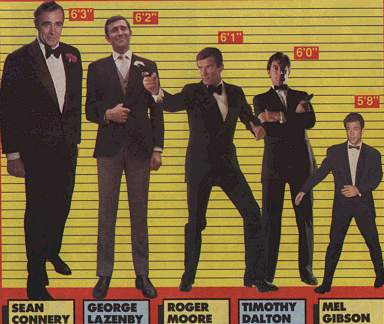
Does height have any effect on how well college quarterbacks play? Of course it does. The average Division I quarterback is taller than the average man. Coaches (whether accurate or not) are biased toward taller players. We know there is a difference between groups (quarterbacks and average joes), but is there a difference within groups? Are taller quarterbacks better passers? Are shorter quarterbacks better runners? To answer these questions, I sampled every Division IA quarterback that threw at least 100 passes last season. I set up an excel file and included four facts about each quarterback: their height in inches, their completion percentage, their TD/INT ratio, and their cummulative rushing yards. I then made three seperate graphs with height as the independent variable and the other three variables as the dependent variables. I also ran a regression analysis and determined the r squared value for height and each dependent variable. Unfortunately, I don't yet know how to transpose the graphs onto this blog so you'll have to take my word for it. Here are the r squared values for each set of variables.
Height and Completion %: .0028
Height and TD/INT Ratio: .0003
Height and Rushing Yards: .0596
No r squared value is very high. Completion percentage and TD/INT ratio both have minute positive relationships with height. Rushing yardage actually has a negative relationship with height. Although it is still very weak, it is exponentially more correlated with height than completion percentage or TD/INT ratio. All in all, this exercise was a lot like getting a degree from an online university: A lot of work and little to show for it. The reason their is no real discernable difference in height is beacuse of the lack of variation in height among college quarterbacks. Of the 140 quarterbacks who threw 100 passes last season, only 5 were under 6 feet and only 18 were over 6 foot 4. Maybe the ACLU can file on suit on the lack of diversity.
Friday, June 23, 2006
How Accurate is the Pythagorean Theorem in College Football?
I doth believe UCLA is in for a decline.
In baseball, the Pythagorean Theorem is a often a better indicator of team strength and usually a better predictor of future performance than a team's actual record. Is this also true in college football? Only one way to find out. I wanted to know which variable was a better predictor of each BCS school's 2005 winning percentage: their 2004 winning percentage or their 2004 Pythagorean winning percentage.
R squared for 2004 win %: .4070
R squared for 2004 Pythagorean win %: .5108
Both variables explain a significant portion of the variability of the 2005 record. However, the Pythagorean winning percentage is a better predictor as it explains roughly 25% more of the variance than the standard winning percentage.
It should be noted that most teams' winning percentages are close to their winning percentages as predicted by the Pythagorean Theorem. Now let's shift gears and focus on those teams who had a significant disparity in their winning percentage and their Pythagorean winning percentage. The cutoff point for 'significant disparity' is an arbitrary one, but I chose .100. That means if a team had a winning percentage of .750, but only a Pythagorean winning percentage of .64, they are included in this portion of the study. 22 teams from 2004 fit this criteria. If you're curious, those teams are listed at the bottom of this article. Using the same methodology as the previous study, I looked to see how well the 2004 winning percentage of these teams predicted their 2005 winning percenatage and then how well their 2004 Pythagorean winning percentage predicted their 2005 winning percentage. Here are the results.
R Squared for 2004 win %: .0428
R Squared for 2004 Pythagorean win %: .3097
When we examine only teams with a significant difference in actual and expected winning percentage the predictive power of their actual record practically disappears. The predictive power of the Pythagorean method is much smaller as well, but a relationship can still be deciphered.
The final study is the same as the first, but this time with the 22 teams with significant differences removed.
R Squared for 2004 win %: .5750
R Squared for 2004 Pythagorean win %: .5826
This result is pretty logical. When a team's actual record closely matches its predicted record, both do a pretty good job of predicting the team's record the next year.
With this data, we can conclude that the Pythagorean Theorem is applicable to college football, and when prospecting forward it is best to look at a team's ratio of points scored to points allowed rather than their actual record.
R squared for 2004 win %: .4070
R squared for 2004 Pythagorean win %: .5108
Both variables explain a significant portion of the variability of the 2005 record. However, the Pythagorean winning percentage is a better predictor as it explains roughly 25% more of the variance than the standard winning percentage.
It should be noted that most teams' winning percentages are close to their winning percentages as predicted by the Pythagorean Theorem. Now let's shift gears and focus on those teams who had a significant disparity in their winning percentage and their Pythagorean winning percentage. The cutoff point for 'significant disparity' is an arbitrary one, but I chose .100. That means if a team had a winning percentage of .750, but only a Pythagorean winning percentage of .64, they are included in this portion of the study. 22 teams from 2004 fit this criteria. If you're curious, those teams are listed at the bottom of this article. Using the same methodology as the previous study, I looked to see how well the 2004 winning percentage of these teams predicted their 2005 winning percenatage and then how well their 2004 Pythagorean winning percentage predicted their 2005 winning percentage. Here are the results.
R Squared for 2004 win %: .0428
R Squared for 2004 Pythagorean win %: .3097
When we examine only teams with a significant difference in actual and expected winning percentage the predictive power of their actual record practically disappears. The predictive power of the Pythagorean method is much smaller as well, but a relationship can still be deciphered.
The final study is the same as the first, but this time with the 22 teams with significant differences removed.
R Squared for 2004 win %: .5750
R Squared for 2004 Pythagorean win %: .5826
This result is pretty logical. When a team's actual record closely matches its predicted record, both do a pretty good job of predicting the team's record the next year.
With this data, we can conclude that the Pythagorean Theorem is applicable to college football, and when prospecting forward it is best to look at a team's ratio of points scored to points allowed rather than their actual record.
Saturday, June 17, 2006
Who Wins Close Games?
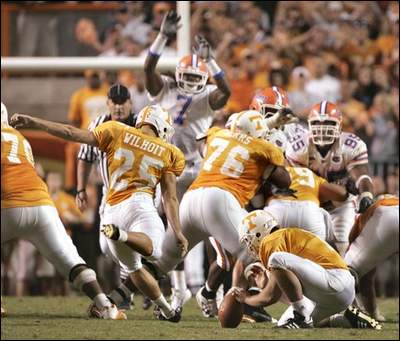
Previously on this blog, I've debunked the fallacy that teams have an 'ability' to win close games. Now I want to take another look. Two writers for baseball prospectus, Rany Jazayerli and Keith Woolner, discovered that bullpen strength influences which teams win close games in Major League Baseball. Does team defensive strength have a similar effect in college football? To answer this question I selected the top 5 defensive teams in terms of scoring defense for each of the past six seasons (2000-2005), a sample of 30 teams. Then I selected the top 5 offensive teams in terms of scoring defense for the past six seasons, another sample of 30 teams. Then I determined each team's record in close games (games decided by 1 score = 8 points or less). Here is the year by year examination of the top 5 scoring offense and top 5 scoring defenses in terms of their record in close games.
2000
Defensive Teams Offensive Teams
Texas Christian 0-2 Boise State 1-2Florida State 1-1 Miami (Fla) 1-1
Toledo 1-1 Florida State 1-1
Western Michigan 2-2 Nebraska 2-1
Miami (Fla) 1-1 Virginia Tech 2-0
Total: 5-7 .417 Total: 7-5 .583
2001
Defensive Teams Offensive Teams
Miami (Fla) 1-0 BYU 5-0
Virginia Tech 0-2 Florida 0-2
Texas 1-1 Miami (Fla) 1-0
Oklahoma 2-1 Fresno State 2-2
Florida 0-2 Hawaii 3-3
Total: 4-6 .400 Total: 11-7 .611
2002
Defensive Teams Offensive Teams
Kansas State 2-2 Boise State 0-0
Ohio State 7-0 Kansas State 2-2
North Texas 2-3 Miami (Fla) 2-1
Georgia 5-1 Bowling Green 1-0
Alabama 2-1 Oklahoma 1-1
Total: 18-7 .720 Total: 6-4 .600
2003
Defensive Teams Offensive Teams
LSU 3-0 Boise State 3-1
Nebraska 1-0 Miami (Ohio) 2-0
Georgia 2-2 Oklahoma 1-1
Miami (Fla) 5-1 Texas Tech 2-2
Oklahoma 1-1 Southern Cal 0-1
Total: 12-4 .750 Total: 8-5 .615
2004
Defensive Teams Offensive Teams
Auburn 3-0 Louisville 2-1
Virginia Tech 4-2 Boise State 3-1
Southern Cal 4-0 Utah 0-0
Florida State 3-3 Bowling Green 0-1
Penn State 1-3 Fresno State 1-2
Total: 15-8 .652 Total: 6-5 .545
2005
Defensive Teams Offensive Teams
Alabama 3-1 Texas 2-0
Miami (Fla) 2-2 Southern Cal 2-1
Virginia Tech 1-1 Louisville 1-1
Georgia 3-3 Texas Tech 2-2
Texas 2-0 Fresno State 0-4
Total: 11-7 .611 Total: 7-8 .467
The 30 strong defensive teams posted a combined record of 65-39 in close games (.625). The 30 strong offensive teams posted a combined record of 45-34 in close games (.570). So it appears strong defensive teams do win more than their fair share of close games. Furthermore, 13 of the 30 strong defensive teams posted winning records in close games, 12 posted .500 records, and only 5 posted losing records. 12 of the strong offensive teams posted winning records in close games, 10 posted .500 records, 6 posted losing records, and 2 had no record.
No statistical study is complete without a control group. To find a control group, I randomly selected 5 teams for each season (numbering each team alpahebtically and using a random number generator) to be the basis for comparison. These team ranged from great (Penn State 2005 and LSU 2003) to medicore (South Carolina 2004) to awful (Duke 2000). Here are those teams and their respective records in close games.
2000
Minnesota 1-4
Duke 0-2
Kansas State 3-1
Southern Miss 3-3
Nevada 2-0
Total: 9-10 .474
2001
Miami (Ohio) 4-3
Mississippi State 2-5
Clemson 4-2
Oklahoma 2-1
Rice 5-1
Total: 17-12 .586
2002
Eastern Michigan 3-1
Louisiana Tech 2-1
Miami (Ohio) 3-3
Virginia 4-2
Colorado 2-2
Total: 14-9 .609
2003
Vanderbilt 0-2
Minnesota 3-2
UTEP 1-2
LSU 3-0
Memphis 1-2
Total: 8-8 .500
2004
Florida State 3-3
South Carolina 2-2
East Carolina 1-2
Hawaii 2-1
San Jose State 1-1
Total: 9-9 .500
2005
Kansas 1-0
Toledo 1-1
Mississippi 2-2
Penn State 3-1
Connecticut 1-1
Total: 8-5 .615
The 30 random teams had a cummulative winning percentage in close games of .551 (65-53). If your memory is short, that is less than the winning percentage of the strong defensive (.625) and offensive (.570) teams. Of those 30 random teams, 14 posted winning records, 9 posted .500 records, and 7 posted losing records. That's actually more teams with winning records, but also more with losing records for the control group.
Judging from this data, strong defensive teams do appear to win more than their fair share of close games. However, there are several important issues to discuss. Foremost, points allowed may not be the best method to rate defenses. Many factors account for scoring points. A team with the best defense may not finish as the top ranked scoring defense if their offense has many turnovers that put them in bad spots or if their special teams do likewise. Perhaps yardage or even yards per play is a better indicator of a defense's true strength. A second problem is schedule strength. The teams in BCS conferences are usually the best defensive teams thanks to the talent they are able to recruit. However, their schedules are also more difficult because they play other BCS schools who are also able to recruit the best talent. For this reason, their points allowed may be higher than small-conference schools that enjoy easier schedules. For example, in 2002 North Texas had the 3rd ranked scoring defense. They shut out 3 teams that season. One of those teams was non-Division IA Nicholls State and the other two were Louisiana Lafayette (averaged 16.92 points per game) and Idaho (averaged 23.75 points per game). The Mean Green did have a stout defense in 2002 (they held Texas, TCU, and Arizona below their seasonal averages), but they were definitely not the third best in the nation. Even though this study is not perfect, something can still be gleaned. Winning close games, while still heavily determined by luck and pure randomness, seem to be a skill that strong defensive teams somewhat possess.
Thursday, June 15, 2006
Steady as She Goes: Addendum
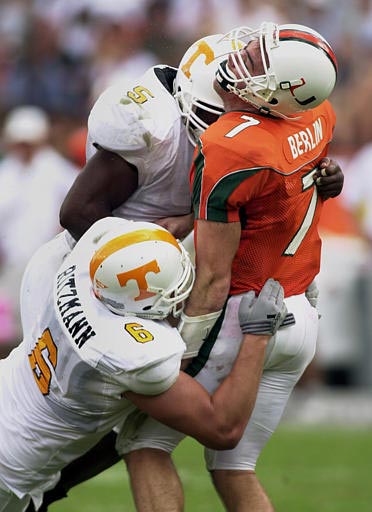
Last week, I posted a small regression analysis of year to year correlation of points scored versus points allowed. In the past week, I have been conducting similar analyses for previous seasons. Here are the results:
Correlation of points per game:
2004-2005: .3375
2003-2004: .3740
2002-2003: .3602
2001-2002: .1415
2000-2001: .2625
Correlation of points allowed per game:
2004-2005: .4108
2003-2004: .2935
2002-2003: .3606
2001-2002: .3868
2000-2001: .4159
If I had stopped after the second regression analysis, I would have concluded that offensive and defensive correlation from year to year was essentially random. However, after looking at 5 seasons worth of data, I am inclined to believe that year to year correlations between defense are more consistent that year to year correlations between offense. The correlation coefficient for defense was higher than offense for 3 of the 5 seasons, lower for only 1 season, and almost equal for another. Furthermore, the range for the correlation coefficient for defense was much smaller (.1224) than the same range for offense (.2325). Thus I believe the conslusion I reached last week remains correct (somewhat). Your thoughts?
Friday, June 09, 2006
Steady as She Goes
In keeping with the spirit of my previous post about consistency, I decided to conduct a little study to see which aspects of a college football team's performance are more consistent over time. Executing the study was simple, I simply calculated how many points per game each Division IA team scored in 2004 and determined how well they predicted each team's points per game in 2005 by using the r squared (correlation coefficient). Here's a technical definition. In laymen's terms, the r squared is the percentage of variation in the 2005 numbers that are explained by the 2004 numbers. I then did the same thing with each Division IA team's defense. The results are below, and to me they are a bit surprsing.
Correlation of points per game 2004-2005: .3375
Correlation of points allowed per game 2004-2005: .4108
Defense, at least from 2004-2005, is more consistent than offensive perfromance. This seems counter-intuitive because defense is a game of reactions. The offense dictates not only the pace, but also the personnel that the defense must have on the field. Later on this week, I will post the correlation for 2003-2004 and also 2002-2003 if I have time. If this holds true, it could be good news for teams like Georgia Tech and Alabama that have had good defenses for a few years running, but have been derailed by below-average offenses. Additionally, it could be bad news for teams like Notre Dame that had dramatic offensive improvements in 2005, but had similar defensive results. Of course, this data is at the macro level, and it would be prudent to consider each case individually when attempting to prospect how each team will do in 2006 relative to their 2005 numbers (graduating players, change in coaching style, etc.). As always, your thoughts on this seemingly counter-intuitive phenomenon are welcome.
Subscribe to:
Posts (Atom)