Thursday, July 27, 2023

First Half Point Differential: The 2022 Power Five

Last week, we looked at first half point differential in the Group of Five to try and identify some teams that might surprise and or disappoint us this season. This week, we do the same with the Power Five. 

Atlantic Coast Conference
The 2022 ACC standings. 

1HPD in ACC play (title game excluded).
Much like 2021, no ACC team dominated the first half of games in 2022. The team that did come out on top has gotten quite a bit of hype heading into 2023. Can they live up to it? Elsewhere in first half play, Duke improved by 191 point in 1HPD. The Blue Devils finished dead last in 2021, trailing at the half by an average of twenty points per game (-160). Under first year head coach Mike Elko, Duke finished fourth in the ACC in 1HPD in 2022!

Big 10
The 2022 Big 10 standings. 

1HPD in Big 10 play (title game excluded). 
Penn State narrowly edged Ohio State for the 1HPD crown in 2022. However, it was the team that finished third in 1HPD (and pretty far behind the Nittany Lions and Buckeyes I might add), that ended up winning the Big 10 for a second straight season. The Wolverines opponent in the Big 10 Championship Game (Purdue) actually finished fifth (out of seven teams) in their own division, but made the plays when it counted to qualify for their first conference title game. 

Big 12
The 2022 Big 12 standings. 

1HPD in Big 12 play (title game excluded). 
Texas finished with the best 1HPD in Big 12 play, but the Longhorns dropped close conference games to Texas Tech, Oklahoma State, and TCU to finish third in the standings and miss out on a trip to the conference title game. The bottom of the standings were a familiar site with Kansas finishing last for yet another season despite qualifying for their first bowl game since the George W. Bush administration. 

Pac-12
The 2022 Pac-12 standings. 

1HPD in Pac-12 play (title game excluded). 
The second (Utah) and third (Southern Cal) place teams in 1HPD met for the Pac-12 title with the second place team capturing their second straight league title. Oregon was the most dominant first half Pac-12 team, but their collapse against arch rival Oregon State cost them a spot in the league championship game. 

SEC
The 2022 SEC standings. 

1HPD in SEC play (title game excluded).
The Bulldogs were not quite as dominant as they were in 2021 (+161 1HPD), but they once again finished first by a healthy margin and managed to avoid an upset in the SEC Championship Game. The quality of their opponent probably had a lot to do with that. LSU finished ninth in the SEC and sixth in their own division in 1HPD!

In the YPP and APR offseason recaps, I sort the teams in each conference by how much they over or under-performed relative to their expected record. Since all the Power Five conferences are grouped together in this post, I am only going to list those that significantly over or under-performed (a difference of at least .200). We'll start with the overachievers.
All five overachievers qualified for their respective conference title games. Michigan and TCU had especially low first half point differentials for unbeaten teams. Michigan only led by double digits in two of their nine Big 10 conference games. They also trailed at the half in two games and were tied in another, but managed to come back and win each. TCU only trailed at halftime in two games, but in both, they were behind by double digits. The Horned Frogs came back to win both (Oklahoma State and Kansas State). Had they lost either, the Big 12 would likely have been shut out of the College Football Playoff. LSU trailed at the half in five of their eight SEC games and did not lead a single conference game by more than a touchdown at halftime! Like Michigan and TCU, Clemson also finished unbeaten in conference play despite middling first half numbers. The Tigers did at least lead by double digits in half their conference games. They only trailed at the half in one conference game, but it was by double digits (Syracuse). Purdue was tied or trailing at the half in two thirds (six) of their Big 10 games! 

And now the underachievers. 
Washington State had a few dominant first halves to skew their numbers somewhat. The Cougars led by double digits at the half in three conference games (+78 1HPD in those games). In their other six Pac-12 games, they were outscored by six total points in the first half. Virginia Tech was not a good team in 2022, but the Hokies were winning or within a field goal at the half in five of their seven ACC games (eighth game against Virginia was canceled). They only managed to win one of the five. Texas led by double digits at halftime in five of their nine Big 12 games and led by at least a touchdown in two others. They also only trailed by by five combined points in their other two conference games. In two seasons under Steve Sarkisian, the Longhorns are 4-8 in one-score Big 12 games (5-1 in multi-score games). If their luck or clutch play does not improve in 2023, Sark may not get to coach a game in the SEC. Texas A&M led three of their eight conference games at halftime and trailed at the half by a field goal or less in three others, but only managed two SEC wins (their fewest since joining the league). Iowa State trailed at the half in eight of their nine Big 12 games, but they were competitive in each (never trailed by more than a touchdown) until the season finale when TCU was up by 27 points. 

Thanks once again for your continued patronage. I'll be back in a few weeks with a Vegas betting recap and then it will time for the season to start. Hooray!

Thursday, July 13, 2023

First Half Point Differential: The 2022 Group of Five

After a brief respite and a throwback post, we return to contemporary team analysis. This week we'll examine First Half Point Differential (1HPD) in conference play for the Group of Five from this past season. For the uninitiated, 1HPD is a very complicated advanced statistic. It is the number of points by which a team outscored (or was outscored) by its opponents in the first half. The theory behind this stat is that teams that pull off a lot of second half comebacks are operating on razor thin margins and may be in for regression the next season. Similarly, teams that have good first half margins, but end up losing more games than we might expect have a solid foundation to build upon and may see improvement the following season. With that out of the way, lets get started. 

American Athletic Conference
The 2022 AAC standings.

1HPD in AAC play (title game excluded). 
The first and third best teams in 1HPD met in the conference title game with the top team hosting and winning. If you think a 1HPD of +64 is relatively low for the top ranked team in a conference you would be correct. However, this was a general trend across the Group of Five in 2022. No team outside the Power Five finished with a positive 1HPD in triple digits. 

Conference USA
The 2022 Conference USA standings.

1HPD in Conference USA play (title game excluded). 
Western Kentucky finished with the best 1HPD, but it was the teams ranked second (UTSA) and third (North Texas) that ended up playing for the league title. The Hilltoppers lost to both the Roadrunners and Mean Green and trailed at the half in both games. At the bottom of the standings, Florida International finished with a IHPD nearly twice as bad as the second worst team (Charlotte). The Panthers trailed by double digits at halftime in six of their eight conference games (average deficit of 27 points). Give the Panthers credit though. They managed to win both games where they led at the half (Charlotte and Louisiana Tech). 

Mid-American
The 2022 MAC standings. 

1HPD in MAC play (title game excluded). 
The top two teams in 1HPD faced off in the MAC Championship Game. The top ranked team dealt with some injury misfortune and the second best team ended up winning the title. Elsewhere, Northern Illinois put up decent numbers for a team that finished last in 1HPD.

Mountain West
The 2022 Mountain West standings. 

1HPD in Mountain West play (title game excluded). 
Like most of the other Group of Five conferences, the top of the 1HPD standings looked pretty similar to the actual standings. The top ranked team (Fresno State) beat the second ranked team (Boise State) in the conference title game. Despite winning the Mountain West, Fresno State actually trailed at the half in four of their eight conference games. However, three of the deficits were a by field goal or less. The top four teams in 1HPD were indistinguishable with twelve points separating Fresno and San Diego State. 

Sun Belt
The 2022 Sun Belt standings.

1HPD in Sun Belt play (title game excluded). 
Yeah. The top of the Sun Belt looks weird. The top two teams in 1HPD (Georgia State and Louisiana-Lafayette) finished a combined 7-9 in conference play. Meanwhile, the teams ranked third (Troy) and fifth (Coastal Carolina) in 1HPD met in the Sun Belt Championship Game. 

In the YPP and APR offseason recaps, I sort the teams in each conference by how much they over or under-performed relative to their expected record. Since all the Group of Five conferences are grouped together in this post, I am only going to list those that significantly over or under-performed (a difference of at least .200). We'll start with the overachievers.
South Alabama and Troy finished tied at the top of the West Division of the Sun Belt, losing just two conference games between them. However, South Alabama was tied or trailing at the half in five of their eight conference games. Troy was a little more dominant, but still trailed at the half in two of their conference games. Between the Jaguars and Trojans, Boise State was the second biggest over-performer relative to their 1HPD. 
Boise State finished unbeaten in conference play, but did not post many dominant first halves. The Broncos also trailed at the half in two of their conference games. Bowling Green finished with a winning MAC record for the first time since 2015. They managed to win all the games where they were not TKO'd in the first half. In all three of their conference losses, the Falcons trailed by at least 20 points at halftime. We talked earlier about how bad Florida International was in 1HPD relative to their brethren in Conference USA. The Panthers played well in exactly two of their conference games in 2022, but they managed to win both. Like Boise State, UTSA finished with an unblemished league record, and while they were leading by double digits at halftime in three of those games, they also trailed at the half in two of them. 

And now the underachievers. 
A few weeks ago, I touched on how New Mexico struggled scoring touchdowns in the second half of their Mountain West games. The Lobos led at the half in three of their conference games, but finished without a single league win. 
Arkansas State led at the half in five of their eight Sun Belt games. In those five contests, they were outscored in the second half by nearly fourteen points per game. Georgia State also led at the half in five of their eight Sun Belt games and were tied at the half in another. In those six contests, the Panthers were outscored by nearly eight points per game in the second half. UTEP led by double digits at halftime in three of their eight conference games. They were tied in another and trailed by three points or less in three more. UTEP should have finished much better than 3-5 and with the better teams in the conference moving on to the AAC, I think the Miners are a darkhorse contender heading into 2023. Akron only led at the half in two conference games, but their overall 1HPD was not befitting a team that finished 1-7. Similarly, Nevada only led at the half in one of their conference games, but their overall 1HPD was not befitting a team that finished winless in conference.  Temple led at the half in three of their eight conference games, but only managed to win one of them.  

Thanks for reading. We'll be back in two weeks with a look at first half point differential in the Power Five. 

Thursday, June 22, 2023

YPP Throwback: The 2001 ACC

Our midsummer tradition continues as we take a look back at some pre-2005 Yards Per Play numbers. This week we take a look back at the 2001 ACC. This marked the first time a team other than Florida State won the ACC since the Seminoles joined the conference in 1992. However, as we'll soon see, the Seminoles were the best team in the conference. But lets start as we always do, with the conference standings. 
Maryland won the ACC for the first time since 1985. Under first year head coach and alum Ralph Friedgen, the Terrapins finished an incredible 7-1 in ACC play. To say the result was surprising was an understatement. The preseason magazines picked the Terrapins to finish seventh, just ahead of Wake Forest and Duke. It marked Maryland's first winning conference record (and bowl appearance) since 1990! Were the Terrapins as good as their pristine conference record? Here are the YPP numbers for the 2001 season. 
Friedgen arrived at Maryland after a four-year stint at Georgia Tech where he was the offensive coordinator for the Yellow Jackets. While the Terps were good on offense (third in the ACC in yards per play), they were equally as impressive defensively. While Maryland shocked the college football world by winning the league in 2001, I think the bigger story from that season is the North Carolina Tar Heels. 

Mack Brown dominated the ACC (outside of Florida State) over his final two seasons in Chapel Hill, going 13-1 against the rest of the league in 1996 and 1997. He parlayed his success at a basketball school into the Texas job where he won a national title with the Longhorns in 2005 and played for another in 2009. His successor, Carl Torbush, quickly brought the Tar Heels back to mediocrity, going 16-18 (10-14 in ACC play) over his three seasons. To replace Torbush, the Tar Heels turned to alum and longtime NFL assistant John Bunting. Bunting played linebacker at North Carolina and later for the Philadelphia Eagles and his experience as an assistant coach in the NFL was on that side of the ball. His defensive acumen, aided somewhat by All-American defensive end Julius Peppers, helped the Tar Heels lead the ACC in yards allowed per play. While they ultimately finished with five losses, they were much better than their record and in my humble opinion, may be the best five loss team in college football history. 

How can I make such a bold proclamation? Let's check the schedule. Not only did North Carolina play two Big 12 teams on the road in non-conference play, they played the two best teams. While neither Oklahoma nor Texas won the Big 12 in 2001, most statistical metrics rate them as the top two teams. The Sooners and Longhorns were ranked third and fourth respectively at the time North Carolina faced them, and both finished in the top six of the final AP Poll. Sandwiched between those two teams, North Carolina went on the road to College Park and lost to the eventual ACC champion Terrapins (final AP ranking of eleventh). After that 0-3 start, the Tar Heels dominated sixth ranked Florida State (the best ACC team by YPP standards). The Seminoles finished fifteenth in the final AP Poll. The Tar Heels were still just 1-3 after their unexpected win against the Seminoles. They won their next four games, culminating with a 38-3 beatdown of Clemson in Death Valley. After climbing into the AP Poll, the Tar Heels lost their next two games at Georgia Tech (final AP ranking of twenty fourth) and home to Wake Forest (only loss to an unranked foe). They beat Duke and SMU to finish 7-5 in the regular season and accepted a Peach Bowl berth against Auburn. The Tar Heels won a defensive battle 16-10 to finish 8-5. Their bold non-conference scheduling coupled with a little bad luck in ACC play resulted in five-loss campaign. Switch out one of those Big 12 road contests with an FCS or mid-major guarantee game and couple that with a little better luck in conference play and Bunting's initial ACC sojourn would be fondly remembered by Tar Heel fans. Alas, 2001 was the highwater mark for the Tar Heels under Bunting. The team would win just two conference games over the next two seasons. A rebound to 5-3 (6-6 overall) in 2004 helped him keep his job, but Bunting has relieved of his duties after the 2006 season having not led the Tar Heels to another bowl appearance. The Tar Heels lost more than twice as many ACC games (27) as they won (13) over his final five seasons after their fine performance in 2001. A better record in 2001 probably would not have saved his job five years later, but that 2001 team was not your typical five-loss college football team. 

Thursday, June 01, 2023

2022 Adjusted Pythagorean Record: Sun Belt

Last week we looked at how Sun Belt teams fared in terms of yards per play. his week, we turn our attention to how the season played out in terms of the Adjusted Pythagorean Record, or APR. For an in-depth look at APR, click hereIf you didn’t feel like clicking, here is the Reader’s Digest version. APR looks at how well a team scores and prevents touchdowns. Non-offensive touchdowns, field goals, extra points, and safeties are excluded. The ratio of offensive touchdowns to touchdowns allowed is converted into a winning percentage. Pretty simple actually.

Once again, here are the 2022 Sun Belt standings. 
And here are the APR standings with conference rank in offensive touchdowns, touchdowns allowed, and APR in parentheses. This includes conference games only with the championship game excluded.
Finally, Sun Belt teams are sorted by the difference between their actual number of wins and their expected number of wins according to APR.
Coastal Carolina was the lone Sun Belt team that saw their actual record differ significantly from their APR. The Chanticleers significantly overachieved relative to their Yards Per Play numbers as well and we went over a few reasons for that last week. 

Last Over First
On October 15th, Old Dominion traveled to Conway, South Carolina to play their second game as a Sun Belt member against Coastal Carolina. The Monarchs won their Sun Belt opener three weeks prior against Arkansas State, but were just 2-3 overall. Their other victory was a memorable upset against Virginia Tech (their second victory against the Hokies in five seasons), but they dropped their other three non-conference games. Meanwhile, the Chanticleers were 6-0 overall and 3-0 in Sun Belt action and just outside the top 25 of the most recent AP Poll. Unsurprisingly, the Chanticleers were favored by double digits. Surprisingly, Blake Watson rushed for 259 yards and the Monarchs won going away 49-21. Old Dominion would not win another game the rest of the season, dropping their final six contests by more than two touchdowns per game. The Chanticleers rebounded from the shocking to defeat to win their next three games and clinch the Sun Belt East. The Chanticleers technically tied for the division title and under normal circumstances would have lost the tiebreaker to James Madison. However, the NCAA, in their infinite wisdom, deemed the Dukes ineligible for any type of postseason play as they transitioned to FBS. Therefore, the last place team in the division defeated the 'division champ'. How often does this happen at the non-BCS/Group of Five level? Not very often. 
In fact, this event is rare enough we can go through each one.

Central Michigan over Western Michigan
Western Michigan was 8-1 overall and unbeaten in the MAC when they traveled to Mount Pleasant in mid-November in 2000. The Chippewas were 1-8, having lost seven consecutive games. The Broncos turned the ball over three times and passed for less than 100 yards in a 21-17 defeat. Central Michigan was blown out by Northern Illinois in their regular season finale while the Broncos rebounded to beat Eastern Michigan and qualify for the MAC Championship Game. The Broncos were forced to play a true road game at Marshall in the title game despite finishing two games ahead of the Herd in the conference standings. Marshall won a tight game and despite a 9-3 record, there were not enough bowl spots for the Broncos and they stayed home for the holidays. 

Central Michigan over Northern Illinois
The Chippewas were at it again eleven years later, handing Northern Illinois their lone conference defeat in 2011. This game came much earlier in the season and after their 48-41 victory, Central Michigan (1-1) was actually ahead of Northern Illinois (0-1) in MAC play. The Huskies would not lose again, closing the season with nine consecutive victories, including a comeback against Ohio in the MAC Championship Game. Central Michigan won just a single game the rest of the season, beating 1-11 Akron by a single point. 

UNLV over Fresno State
Fresh off their first bowl appearance in more than a decade, UNLV finished 2-11 and won just a single Mountain West game in 2014. The Rebels beat Fresno State in overtime in mid-October, kicking off a three game conference skid for the Bulldogs. At 3-6, the Bulldogs rallied to win their final three league games to qualify for the second ever Mountain West Championship Game. The Bulldogs lost to Boise State to fall to 6-7, but still qualified for a bowl game where they also lost to Rice to finish 6-8 overall. 

Navy over Memphis
Navy opened conference play with a 22-21 victory against Memphis. The Midshipmen beat Lehigh the following week, but went two months before their next victory. Memphis actually lost their first two conference games (Tulane) but won five of their last six to finish in a three-way tie with Houston and Tulane. It was a Rock/Paper/Scissors situation (Memphis beat Houston who beat Tulane who beat Memphis), but Memphis had the better division record so they advanced to the AAC Championship Game where they lost to UCF. 

Fresno State over Hawaii
Fresno State entered the 2019 season as the two-time defending division champ. They actually began the 2019 season 2-2 in Mountain West play (4-4) overall, including a tight victory at Hawaii. The Bulldogs dropped their final four league games and finished tied with San Jose State and UNLV at the bottom of the West Division. After their loss to Fresno State dropped them to 2-3, Hawaii won their final three league games with the coup de grace coming in a winner-take-all battle with San Diego State. However, the Warriors did not put up much of a fight in the Mountain West Championship Game, losing to Boise State by three touchdowns. 

Western Michigan over Kent State and Northern Illinois
Western Michigan was the 'People's Champ' of the 2021 MAC by beating both title game participants. They dominated both, beating Kent State by 33 points and Northern Illinois by 21 (in a meaningless game). The Broncos actually finished 4-4 in MAC play, but that was only good for a tie for last place in the West Division

Old Dominion endured a lost season in 2022, but they accomplished something few other last place teams have. In addition to beating one of the conference title game representatives, they also became the only team to beat Grayson McCall in Conway

This concludes our season recaps. Thanks for hanging with us through the first half of the offseason. We will be taking a little break, but we'll be back with some throwback YPP posts in three weeks. We'll follow that up with some First Half Point Differential recaps and a Vegas trip post. And then, it will almost be time for the season to start. Enjoy the start of your summer and check back here in late June. Thanks for reading.

Thursday, May 25, 2023

2022 Yards Per Play: Sun Belt

I know it doesn't seem possible, but somehow we have arrived at our last conference recap. This week we focus on the Sun Belt. 

Here are the 2022 Sun Belt standings.
So we know what each team achieved, but how did they perform? To answer that, here are the Yards Per Play (YPP), Yards Per Play Allowed (YPA) and Net Yards Per Play (Net) numbers for each Sun Belt team. This includes conference play only, with the championship game not included. The teams are sorted by division by Net YPP with conference rank in parentheses.
College football teams play either eight or nine conference games. Consequently, their record in such a small sample may not be indicative of their quality of play. A few fortuitous bounces here or there can be the difference between another ho-hum campaign or a special season. Randomness and other factors outside of our perception play a role in determining the standings. It would be fantastic if college football teams played 100 or even 1000 games. Then we could have a better idea about which teams were really the best. Alas, players would miss too much class time, their bodies would be battered beyond recognition, and I would never leave the couch. As it is, we have to make do with the handful of games teams do play. In those games, we can learn a lot from a team’s YPP. Since 2005, I have collected YPP data for every conference. I use conference games only because teams play such divergent non-conference schedules and the teams within a conference tend to be of similar quality. By running a regression analysis between a team’s Net YPP (the difference between their Yards Per Play and Yards Per Play Allowed) and their conference winning percentage, we can see if Net YPP is a decent predictor of a team’s record. Spoiler alert. It is. For the statistically inclined, the correlation coefficient between a team’s Net YPP in conference play and their conference record is around .66. Since Net YPP is a solid predictor of a team’s conference record, we can use it to identify which teams had a significant disparity between their conference record as predicted by Net YPP and their actual conference record. I used a difference of .200 between predicted and actual winning percentage as the threshold for ‘significant’. Why .200? It is a little arbitrary, but .200 corresponds to a difference of 1.6 games over an eight game conference schedule and 1.8 games over a nine game one. Over or under-performing by more than a game and a half in a small sample seems significant to me. In the 2022 season, which teams in the Sun Belt met this threshold? Here are Sun Belt teams sorted by performance over what would be expected from their Net YPP numbers.
Appalachian State and Old Dominion underachieved relative to their YPP numbers while Coastal Carolina and South Alabama overachieved. For three of the four teams, close game results tells the story. Appalachian State, the preeminent Sun Belt program since their arrival in 2014, finished 1-4 in one-score conference games. In the process, they finished with the first losing conference record as an FBS team. However, their one close Sun Belt victory was quite memorable. On the flip side, Coastal Carolina finished 4-0 in one-score conference games while South Alabama was 5-1 in such contests. The reasons for Old Dominion's underachievement are a little less clear. The Monarchs were 1-2 in one-score conference games and had a negative in-conference turnover margin (-2), but the I believe the biggest reason for their underachievement was fourth down variance. In Sun Belt play, the Monarchs attempted fifteen fourth down conversions. They were only successful four times. Meanwhile, their opponents had twenty fourth down attempts, of which they converted thirteen (65%). Those extra possessions cost the Monarchs dearly in their six game skid to close the season. 

The Coach or The Quarterback?
For a coach in his mid-forties, Jamey Chadwell has been around the block. The former Coastal Carolina head coach is now at Liberty which is his fifth head coaching stop. Chadwell was successful at three of his previous four stops, making the Division II playoffs at North Greenville, the FCS playoffs at Charleston Southern, and winning two division titles at Coastal. We'll give him an 'Incomplete' for his one year stint at Delta State. His stint at Coastal introduced him to a national audience as his triple-option variant offense helped the Chanticleers solidify themselves as contenders in the Sun Belt. And while Coastal Carolina has been fantastic over the past three seasons, I would make the argument a certain quarterback deserves more credit then Chadwell. 

Chadwell's head coaching career at Coastal was a bit wonky. He left Charleston Southern to become the offensive coordinator at Coastal in January of 2017. In July of that year, he was named interim head coach when Joe Moglia took a medical leave of absence. Moglia returned to coach the team in 2018 and Chadwell resumed his duties as offensive coordinator. Moglia stepped down after the 2018 season and Chadwell became the full-time head coach. In all, Chadwell was was the head coach at Coastal Carolina for five seasons (2017, 2019-2022) and on staff for six. 

Coastal was known for being coached by a former CEO of TD Ameritrade, but other than that, they toiled in FBS obscurity until Grayson McCall came along. McCall threw four passes as a true freshman in 2019, but was the starting quarterback heading into the wild and extemporaneous 2020 season. His first start for the Chanticleers came in a road win against a Power Five team (granted, it was Kansas) and he never really slowed down from there. If McCall had played 35 years ago, the college football media would have had a great opportunity to christen him with a nickname related to the hero of a contemporary spy thriller (I know the show has been rebooted, but does anyone watch?). But I digress. If you look at the numbers, as we are want to do around here, you'll see that Chadwell has not done much (at the FBS level) without McCall running his system.

This analysis is going to focus on the years that Chadwell was at Coastal as head coach and ignore his one season as offensive coordinator (2018). I wanted to get a clear picture of how Chadwell's offenses performed when he was fully in charge of the team. Check the stats from 2018 and you'll see we are probably doing him a solid by ignoring that campaign for what its worth. Anyway, I am going to compare Coastal's offensive performance against Sun Belt opponents with and without McCall. The results may surprise you. 

We'll begin with one of the standard numbers we like to use around here: Yards Per Play. Coastal played two full seasons of Sun Belt action without McCall in 2017 and 2019. He has been around for the past three seasons, missing five total games (one in 2020 and two apiece in 2021 and 2022). Here is how Coastal has fared with and without McCall in that span in each individual season and cumulatively against Sun Belt opponents in the regular season. 
Coastal's offense has been more than a yard and a half better with McCall under center (or in the shotgun) versus without him. Even with the offense declining somewhat in 2022 with the loss of playmakers like Isaiah Likely, McCall has kept the among the best in the Sun Belt. For comparison's sake, Coastal's per play offensive numbers with McCall would have ranked third in the Sun Belt in 2022 (behind James Madison and Appalachian State), while their numbers without McCall would have ranked thirteenth (just ahead of Arkansas State). 

Yards are nice, but points are what win games. Using the same parameters as before, here is how Coastal's raw point totals have varied with and without McCall. 
The Chanticleers have averaged nearly twelve additional points per game with McCall than without him. The difference was especially pronounced in 2022, with the team nearly doubling their points per game with McCall. 

Finally, to quote notable talking head and hypocrite, Herm Edwards, you play to win the game. Here is how the Chanticleers have performed in wins and losses with and without McCall. 
The Chanticleers have dropped two (regular season) games with McCall at the helm. On the road in a weeknight thriller at Appalachian State in 2021 and a peculiar home blowout to Old Dominion in 2022. I know Troy fans may be miffed at me leaving out the 2022 Sun Belt Championship Game, but again we are looking at regular season games only.  

What are we to make of this? I'm not predicting Chadwell will fail spectacularly at Liberty, but I can unequivocally say that Chadwell has not been successful at the FBS level without Grayson McCall running his offense. The Flames are positioned on paper to lord over (see what I did there?) the new look Conference USA, but I would temper my expectations. 

Got a problem? Odds against you? Call The Equalizer: 212-555-4200

Thursday, May 18, 2023

2022 Adjusted Pythagorean Record: SEC

Last week we looked at how SEC teams fared in terms of yards per play. his week, we turn our attention to how the season played out in terms of the Adjusted Pythagorean Record, or APR. For an in-depth look at APR, click hereIf you didn’t feel like clicking, here is the Reader’s Digest version. APR looks at how well a team scores and prevents touchdowns. Non-offensive touchdowns, field goals, extra points, and safeties are excluded. The ratio of offensive touchdowns to touchdowns allowed is converted into a winning percentage. Pretty simple actually. 

Once again, here are the 2022 SEC standings. 
And here are the APR standings with conference rank in offensive touchdowns, touchdowns allowed, and APR in parentheses. This includes conference games only with the championship game excluded.
Finally, SEC teams are sorted by the difference between their actual number of wins and their expected number of wins according to APR.
No SEC team saw their actual record differ significantly from their APR. 

Biggest Mismatches in Conference Title Games Part II
Last week, we looked at the biggest mismatches in conference title games based on the difference in the participating teams' Net YPP. This week, we are going to do the same exercise, but instead use APR. While I typically list APR as an actual win total, in this table it is listed as a winning percentage so we can get a true measure of the difference since each conference does not play the same number of league games. With that intro out of the way, I present to you the biggest APR conference title game mismatches (since 2005). 
The 2022 SEC Championship Game rated as the eight biggest mismatch based on Net YPP and rates a similar seventh in APR. Since 2005, there have been fourteen conference title games where one team entered with an APR at least .300 greater than their opponent. The ACC and MAC have been responsible for eight of those fourteen instances (four apiece). However, the biggest mismatch was the inaugural Pac-12 Championship Game. Oregon was rolling in their third season under Chip Kelly, while UCLA qualified for the title game on a technicality. They actually finished two games behind Southern Cal in the South Division, but the Trojans were ineligible for postseason play

As I mentioned last week, no discussion of mismatches would be complete without a look at how each game played out relative to the betting line. Once again, it is necessary to divide the cohort into BCS/Power Five and non-BCS/Group of Five leagues. Here are the results for the BCS/Power Five conferences. 
All eight BCS/Power Five mismatches featured games involving a spread of at least two touchdowns. The favorite won seven of the eight games, with Virginia Tech suffering the lone loss in the inaugural ACC Championship Game in 2005. Favorites also went 6-2 against the spread with Oregon failing to cover their massive spread against UCLA in 2011. Brace yourselves. The non-BCS/Group of Five teams did not fare nearly as well. 
The spreads were not quite as high at the non-BCS/Group of Five level, but five of six were at least double digits. However, only two of six favorites even won the game outright. And they were a perfect 0-6 against the spread. I mentioned it last week, but it bears repeating, talent is clustered much closer together at the non-BCS/Group of Five level than at the BCS/Power Five level. While these lower tier teams may significantly outplay their conference title opponents over the course of the season, their raw talent levels are usually closer so they have a hard time covering these large numbers. 

Thursday, May 11, 2023

2022 Yards Per Play: SEC

Only two conferences left in our offseason sojourn. After a month spent out west, we return to the south and the place where college football is king. 

Here are the 2022 SEC standings.
So we know what each team achieved, but how did they perform? To answer that, here are the Yards Per Play (YPP), Yards Per Play Allowed (YPA) and Net Yards Per Play (Net) numbers for each SEC team. This includes conference play only, with the championship game not included. The teams are sorted by division by Net YPP with conference rank in parentheses.
College football teams play either eight or nine conference games. Consequently, their record in such a small sample may not be indicative of their quality of play. A few fortuitous bounces here or there can be the difference between another ho-hum campaign or a special season. Randomness and other factors outside of our perception play a role in determining the standings. It would be fantastic if college football teams played 100 or even 1000 games. Then we could have a better idea about which teams were really the best. Alas, players would miss too much class time, their bodies would be battered beyond recognition, and I would never leave the couch. As it is, we have to make do with the handful of games teams do play. In those games, we can learn a lot from a team’s YPP. Since 2005, I have collected YPP data for every conference. I use conference games only because teams play such divergent non-conference schedules and the teams within a conference tend to be of similar quality. By running a regression analysis between a team’s Net YPP (the difference between their Yards Per Play and Yards Per Play Allowed) and their conference winning percentage, we can see if Net YPP is a decent predictor of a team’s record. Spoiler alert. It is. For the statistically inclined, the correlation coefficient between a team’s Net YPP in conference play and their conference record is around .66. Since Net YPP is a solid predictor of a team’s conference record, we can use it to identify which teams had a significant disparity between their conference record as predicted by Net YPP and their actual conference record. I used a difference of .200 between predicted and actual winning percentage as the threshold for ‘significant’. Why .200? It is a little arbitrary, but .200 corresponds to a difference of 1.6 games over an eight game conference schedule and 1.8 games over a nine game one. Over or under-performing by more than a game and a half in a small sample seems significant to me. In the 2022 season, which teams in the SEC met this threshold? Here are SEC teams sorted by performance over what would be expected from their Net YPP numbers.
LSU and Vanderbilt both significantly overachieved relative to their expected record based on YPP. For LSU, that earned them some fringe playoff chatter late in the season and a spot in the SEC Championship Game. For Vanderbilt, it got them to five wins for the first time since 2018. LSU and Vanderbilt both won the close ones in 2022. LSU was 3-0 in one-score conference games, beating Alabama, Arkansas, and Auburn by a combined eight points. The Tigers were also waxed in both of their conference losses, losing to Tennessee by 27 and Texas A&M by 15. Vanderbilt was 2-1 in one-score conference games, beating Kentucky and Florida in back-to-back weeks for their first league wins in more than three years. While the Commodores won multiple SEC games, that does not mean they played well. In fact, their YPP was actually worse than it was in 2021. Aside from the aforementioned bright spots against Kentucky and Florida, Vanderbilt lost three conference games by at least fifty points!

Biggest Mismatches in Conference Title Games Part I
For the second straight year, Georgia rated out as the top SEC team in Yards Per Play. And for the second consecutive year, the Bulldogs won the East with no problem. If you were paying close attention, you may have noticed their opponent in the SEC Championship Game, the venerable LSU Tigers, were pretty mediocre by YPP standards. The Tigers finished eighth in the SEC and were actually underwater with a negative YPP. This piqued my curiosity. Was this the largest mismatch in any conference title game, at least based on YPP difference? I have been collecting YPP data since 2005, so all the nineties and early aughts title games are not included, but we can still see where this game ranks in recent history. 
I was initially only going to include the top ten and then I was going to separate out BCS/Power Five and non-BCS/Group of Five leagues, but there were only thirteen instances with a difference of at least two yards per play, so I included them all. Surprisingly, Georgia and LSU only rank as the eighth largest mismatch in terms of YPP disparity. The ACC holds the top two spots and has the most total appearances on this list with four. All four occurrences feature good to great Clemson and Florida State teams taking on relative also-rans that spun and won the ACC Wheel of Destiny

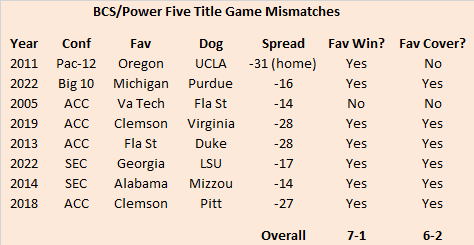
Of course, what examination of mismatches would be complete without a quick look at how each conference title game played out, both straight up and against the spread. After compiling these numbers, I realized it would be prudent to separate them into BCS/Power Five and non-BCS/Group of Five conferences for reasons you will soon understand. 
The BCS/Power Five mismatches ended about how you might have expected. Eight of the nine mismatches involved double digit point spreads, with five coming in at 24 points or more. The favored team won all nine games and covered in seven of nine. Only one game, the 2012 ACC Championship Game, was decided by single digits. Intuitively, this makes sense. Outside of that 2012 Florida State team (which posted fantastic YPP numbers), the other eight teams on this list all eight made the College Football Playoff or played in the BCS National Championship Game. Four won national titles and two others played for national titles. They were supremely talented and its no shock they dispatched their conference title game opponents with relative ease. For the non-BCS/Group of Five teams, well that's another story. 
Granted, its a small sample size, but the four mismatched favorites at the non-BCS/Group of Five level went 1-3 against the spread and one actually lost the game outright. Unlike their brethren at the BCS/Power Five level, these spreads were more compressed. Half were single digits and only one was more than twenty points. If you think about it a little, this makes sense. While the BCS/Power Five mismatches often featured teams with massive talent disparities. For example, based on the 247 composite ratings, Florida State was eleventh in roster talent in 2013. Duke was 71st. This is often not the case at the non-BCS/Group of Five level. While Buffalo played much better than Ball State in 2020, the Cardinals actually had more underlying talent

You may have noticed this piece was titled Part I. That often means a Part II is in the works. I'm not Mel Brooks, so there will not be a big gap before Part II drops. Look for it in the SEC APR write up next week. 

Thursday, May 04, 2023

2022 Adjusted Pythagorean Record: Pac-12

Last week we looked at how Pac-12 teams fared in terms of yards per play. his week, we turn our attention to how the season played out in terms of the Adjusted Pythagorean Record, or APR. For an in-depth look at APR, click hereIf you didn’t feel like clicking, here is the Reader’s Digest version. APR looks at how well a team scores and prevents touchdowns. Non-offensive touchdowns, field goals, extra points, and safeties are excluded. The ratio of offensive touchdowns to touchdowns allowed is converted into a winning percentage. Pretty simple actually.

Once again, here are the 2022 Pac-12 standings. 
And here are the APR standings with conference rank in offensive touchdowns, touchdowns allowed, and APR in parentheses. This includes conference games only with the championship game excluded.
Finally, Pac-12 teams are sorted by the difference between their actual number of wins and their expected number of wins according to APR.
Southern Cal was the lone Pac-12 team to see their APR differ significantly from their actual record. The Trojans also overachieved relative to their expected record based on Yards Per Play and we went over some reasons for that last week. 

Not So Lonely at the Bottom
Take a look back at last week's YPP write up of the Pac-12. I'll wait.

Did you notice something at the bottom of the standings? Yes, Colorado and Stanford both finished with a single conference win. But perhaps more significantly, they both nearly finished underwater by two yards per play. The Buffaloes were outgained by their Pac-12 opponents by 2.66 yards per play. Meanwhile, the Cardinal were play away from joining them as they were outgained by 1.98 yards per play by their Pac-12 opponents. This got me wondering how often two teams in the same conference (in the same year of course) were dominated on a per play basis to such an extent. Well, now I have the answer. 
The Cardinal and Buffaloes just missed the cut in 2022, but this phenomenon had occurred three times in the previous two non-pandemic years. My YPP data goes back to 2005, and while it is a rare event, it does seem to be happening more frequently now. Three times in the past four seasons is not a robust sample and could be random, but it is worth monitoring in this new era of college football. With the transfer portal, accelerated recruiting calendar, and college football traditional hegemonic distribution of talent, some bad teams may phone it in late in the year.