Sunday, March 25, 2007

Conference USA Rewind: SDPI

One way to look at team strength, taken from Eddie Epstein’s fantastic book Dominance, is to look at teams points scored and allowed relative to the league average and standard deviation. The more standard deviations they are from the mean, the better (or worse they are). For those unfamiliar with what standard deviation is here’s the wikipedia link. In the coming weeks, I will be looking at each Division IA conference and ranking each team in regards to their Standard Deviation Power Index in conference play. Keep in mind, the SDPI does not adjust for schedule strength for conferences such as the ACC where each team does not play each other and it ignores special teams which can play a significant role in both points scored and points allowed.

If you want the meat of the article, skip this next paragraph as it just gives an example of how the SDPI is calculated. The mean points scored and allowed for all Conference USA teams in conference play (championship game not included) was 206.75 points. The standard deviation for points scored was 38.90. The standard deviation for points allowed was 43.09. East Carolina scored 188 and allowed 154 points. The Pirates' offensive SDPI was -0.48= ([188-206.75]/38.90). Their defensive SDPI was 1.22 = ([206.75-154]/43.09). Their total SDPI was 0.74. This was the fourth best mark in Conference USA in 2006.

First here's the link to the 2006 Conference USA Standings to refresh your memory.

Now here are the 2006 SDPI Standings:

Houston 2.54
Southern Miss 1.90
Tulsa 1.70
East Carolina 0.74
Rice 0.38
Marshall 0.32
Southern Methodist 0.12
Central Florida -0.97
UTEP -1.03
UAB -1.07
Memphis -1.50
Tulane -3.12

Conference USA played out according to form in 2006 as the two best teams squared off in the Championship Game with Houston taking the title.

Best Offense: Houston 1.75
The Cougars not only were very good offensively, but also very balanced. Quarterback Kevin Kolb threw for over 3800 yards and 30 touchdowns (with a scant 4 interceptions). Two players had over 900 yards rushing and three had over 600 yards receiving.

Worst Offense: Tulane -1.97
The Green Wave were actually just a shade below average until their last three conference games when they scored 3, 10, and 3 points respectively while averaging just 177 yards per game. During that stretch they averaged 1.6 yards per rush and 4.8 yards per pass.

Best Defense: Southern Miss 1.73
The Golden Eagles held every conference opponent under 20 points except Memphis and Houston.

Worst Defense: Memphis and Tulane -1.14
Both the Tigers and Green Wave were very similar in terms of defensive ineptitude. In their eight conference games, both gave up at least 40 points twice, at least 30 points five times, and at least 20 points seven times. Tulane was able to hold one opponent to single digits (Central Florida managed only 9 points), while Memphis' best defensive showing was against UTEP when they held the Miners to 19.

Best Team that Didn't Go to a Bowl: Marshall 0.32
The Thundering Herd went 4-4 in conference play, but only 5-7 overall thanks to non-conference trips to West Virginia, Kansas State, and Tennessee.

Worst Team that Went to a Bowl: Rice 0.38
The Owls finished 6-2 in conference play and went to their first bowl game since 1961. However, they were an extremely fortunate team. Of their eight conference games, six were decided by 6 points or less, including 3 by a single point. The Owls had a 5-1 record in those close games.

Toughest Schedule (ranked by sum of opponent's SDPI): Tulane 4.96
The Green Wave played in the tougher division in 2006 (West), plus they drew the top team from the East (Southern Miss) and avoided the worst (Memphis). Schedule strength also a bit misleading because teams cannot play themselves and Tulane was far and away the worst team in Conference USA.

Easiest Schedule (ranked by sum of opponent's SDPI): Marshall -4.93
Played in the weaker division and had the fortune of drawing the bottom three teams from the West in their intra-conference schedule (Tulane, UTEP, and Southern Methodist) while avoiding the top three (Houston, Tulsa, and Rice).

Entire Schedule Strength (hardest to easiest):
Tulane 4.96
Memphis 4.13
East Carolina 0.88
Southern Methodist 0.46
Central Florida 0.19
Tulsa 0.03
UAB -0.04
UTEP -0.63
Rice -1.09
Southern Miss -1.36
Houston -2.52
Marshall -4.93

Team(s) Likely to Decline: Rice and Houston
As a Wake Forest alum and fan, I was as delighted as anyone that Rice, another diminutive Division IA school, went bowling in 2006. However, their great conference record masked a team that was both extremely lucky (the aforementioned 5-1 record in close games) and terrible defensively (112th nationally in scoring defense). The Owls also recovered 30 of 49 fumbles in 2006 (combined offense and defense)--over 61% compared to an NCAA average of 50%. Couple those three things with the departure of head coach Todd Graham who bolted for another small school--Tulsa, and you have all the trappings of a team that will seriously regress in 2007. On the other hand, Houston paired a great record with great performance in 2006, but lose a ton of talent. Gone are the starting quarterback, running back, and leading receiver. The team does return four offensive linemen and seven starters on defense, so a bowl bid is an attainable goal, but another conference title is not.

Team(s) Likely to Improve: Memphis and Southern Methodist
2006 was a year of change for the Memphis Tigers. They lost both their starting quarterback and superstar running back (DeAngelo Williams) from the previous season. This season they return both their starting running back, Justin Doss, who may be light years away from DeAngelo Williams, but is still a productive college player, and quarterback Martin Hankins. Hankins had a solid season in his first year as a starter (60% completion rate with 18 touchdowns and 13 interceptions) and should improve as he enters his senior year. The defense will be hard pressed to be any worse than last season and the schedule also improves with the Tigers avoiding Tulsa and Houston from the West, while picking up Tulane and a Rice team that should not be as strong as last years incarnation. The cherry on top is that the Tigers will surely improve on last season's 0-5 mark in close games. Down in Dallas, the Pony Express may have the league's most exciting player in sophomore quarterback Justin Willis. As a redshirt freshman in 2006, all Willis did was throw 26 touchdown passes against a paltry 6 interceptions in helping the Mustangs to their first non-losing season since 1997. The Mustangs also bring back four starting offensive linemen and six starters on defense. However, the rub is in the schedule as they draw what likely will be the league's top three teams (Southern Miss, Tulsa, and Houston) on the road. If they can steal one of those games, they will be heading to a bowl game for the first time since 1984.

Best Chance to Crash the BCS: Tulsa
This was a tough call between Tulsa and Southern Miss. Both schools avoid each other in the regular season, so should they play each other, it will be in the Conference USA Championship Game. In conference play, Tulsa gets their strongest competition (Houston and Southern Methodist) at home and the road slate is relatively light with trips to Rice, Tulane, UTEP, and Central Florida. In non-conference play they travel to Army and Louisiana-Monroe, two teams they should handle. Their home non-conference schedule is a different beast as they will take on BYU and in-state rival Oklahoma. Still, better to play the Sooners in Tulsa than Norman. The Golden Hurricane return their senior quarterback Paul Smith who should shine under new coach Todd Graham. However, they do lose four offensive linemen and and six starters on defense, so an undefeated season in conference play (which barring an upset over the Sooners is likely the resume needed for a BCS bid) is unlikely. Southern Miss (who plays at Tennessee) and Tulsa probably have similar chances of crashing the BCS, which is to say fans of neither school should fret about making other New Years' plans.

Tuesday, March 20, 2007

Mountain West Rewind: SDPI

One way to look at team strength, taken from Eddie Epstein’s fantastic book Dominance, is to look at teams points scored and allowed relative to the league average and standard deviation. The more standard deviations they are from the mean, the better (or worse they are). For those unfamiliar with what standard deviation is here’s the wikipedia link. In the coming weeks, I will be looking at each Division IA conference and ranking each team in regards to their Standard Deviation Power Index in conference play. Keep in mind, the SDPI does not adjust for schedule strength for conferences such as the ACC where each team does not play each other and it ignores special teams which can play a significant role in both points scored and points allowed.

If you want the meat of the article, skip this next paragraph as it just gives an example of how the SDPI is calculated. The mean points scored and allowed for all Mountain West teams in conference play was 189 points. The standard deviation for points scored was 64.31. The standard deviation for points allowed was 53.52. Utah scored 232 and allowed 171 points. The Utes' offensive SDPI was 0.67 = ([232-189]/64.31). Their defensive SDPI was 0.34 = ([189-171]/53.52). Their total SDPI was 1.00 (not 1.01 because the values given earlier were rounded). This was the third best mark in the Mountain West in 2006.

First here's the link to the 2006 Mountain West Standings to refresh your memory.

Now here are the 2006 SDPI Standings:

BYU 3.41
TCU 2.17
Utah 1.00
New Mexico -0.34
Wyoming -0.35
Air Force -0.49
Colorado State -1.31
San Diego State -1.85
UNLV -2.24

BYU dominated the Mountain West in 2006. They were challenged only once, in the season-finale against arch rival Utah, which they won on the games final play.

Best Offense: BYU 1.99
Senior quarterback John Beck led the Stormin' Mormon attack that broke 30 points in all but one conference game.

Worst Offense: Colorado State -1.18
After a 4-1 start, including wins that looked very good at the time--Colorado and Fresno State, the Rams lost their last 7. They were held to single digits in 3 of those games. For the season, the running game averaged under two and a half yards per rush.

Best Defense: BYU and TCU 1.42
The Cougars and Horned Frogs allowed just one opponent each to break the 30-point barrier.

Worst Defense: UNLV -1.76
Every conference opponent scored at least 20 points, and five managed to score more than 30.

Best Team that Didn't Go to a Bowl: Wyoming -0.35
Unfortunately for the Cowboys, there is no Wyoming Bowl. The 'Pokes finished ahead of New Mexico in the standings, and slightly behind them in SDPI.

Worst Team that Went to a Bowl: New Mexico -0.34
From the numbers (and postseason performance), its pretty clear their was a steep drop-off after the top three teams in the Mountain West.

Schedule Strength: No need to rank schedule strength since everybody plays everybody in the 9-team league.

Team(s) Likely to Decline: BYU and TCU
The top of the league should be open next season. Gone from the Cougars are quarterback John Beck and his 32 touchdown passes as well as Curtis Brown and his 1000 rushing yards. Plus tight end Jonny Harline has moved on as well (ask Oregon what kind of matchup problems he creates). The Cougars do lose only three defensive starters, so that unit should still be superb. Forget about another undefeated conference season though. TCU seems to be the chic offseason pick to win the Mountain West and perhaps crash the BCS. They lose a lot of experience too, particularly under center where Jeff Ballard must be replaced. Their leading receiver is also gone as is the right side of the offensive line and the entire defensive backfield. TCU is more likely to go 5-3 than they are to go 8-0.

Team(s) Likely to Improve: Colorado State and Air Force
Two former WAC/Mountain West powers should return to respectability, if not the top of the conference. Colorado State was much better than its 1-7 conference mark last season and should improve on that number with 7 starters returning on defense and an offense that can't possibly be any worse. Air Force was a tough luck 2-5 in close games last season (2-3 in conference play) so with a few fortuitous bounces, they could be back in a bowl game for the first time since 2002.

Best Chance to Crash the BCS: Utah
The Utes probably won't go undefeated in conference play, which they would likely need to do to crash the party, since they must travel to both BYU and TCU. However, those two teams simply lose too much to be legitimate threats to appear in a BCS bowl. Utah does have a rough non-conference slate with Oregon State, UCLA, and Louisville all on the schedule. The Louisville game is a likely loss, but the Utes could conceivably take the other two (Beavers on the road and Bruins at home). Still, the Mountain West will more than likely not provide college football fans with their second BCS participant in four years.

Monday, March 12, 2007

WAC Rewind: SDPI

One way to look at team strength, taken from Eddie Epstein’s fantastic book Dominance, is to look at teams points scored and allowed relative to the league average and standard deviation. The more standard deviations they are from the mean, the better (or worse they are). For those unfamiliar with what standard deviation is here’s the wikipedia link. In the coming weeks, I will be looking at each Division IA conference and ranking each team in regards to their Standard Deviation Power Index in conference play. Keep in mind, the SDPI does not adjust for schedule strength for conferences such as the ACC where each team does not play each other and it ignores special teams which can play a significant role in both points scored and points allowed.

If you want the meat of the article, skip this next paragraph as it just gives an example of how the SDPI is calculated. The mean points scored and allowed for all WAC teams in conference play was 231.22 points. The standard deviation for points scored was 100.54. The standard deviation for points allowed was 71.73. San Jose State scored 192 and allowed 172 points. The Spartans' offensive SDPI was -0.39 = ([192-231.22]/100.54). Their defensive SDPI was 0.83 = ([231.22-172]/71.73). Their total SDPI was 0.44. In the 2006 WAC, that was fourth best.

First here's the link to the 2006 WAC Standings to refresh your memory.

Now here are the 2006 SDPI Standings:

Hawaii 2.55
Boise State 2.01
Nevada 1.53
San Jose State 0.44
Fresno State -0.02
New Mexico State -0.44
Idaho -1.39
Utah State -2.29
Louisiana Tech -2.36

SDPI is probably more biased against high-scoring offensive teams that against stout defensive teams since theoretically you can score an infinite number of points, but its impossible to allow less than zero. Still, you can make a cogent (though possibly incorrect) argument that Hawaii was the WAC's best team. They are a notoriously poor road team that lost only one conference game all season; on the road to the conference champion (who is notoriously tough at home) by a mere seven points.

Best Offense: Hawaii 2.06
No surprise here. Colt Brennan and Co. scored more than 100 points more than the second best offense (Boise State).

Worst Offense: Utah State -1.08
Only scored 15 offensive touchdowns in a league not renowned for its defense.

Best Defense: Nevada 1.24
For all the accolades heaped upon the 'Pistol' offense, the defense carried the Wolfpack to another bowl berth.

Worst Defense: Louisiana Tech -1.59
Every WAC team except Idaho scored at least 34 points on the Bulldogs.

Best Team that Didn't Go to a Bowl: Fresno State -0.04
Bulldogs done in by their tough non-conference schedule (0-4 record against Oregon, Washington, Colorado State, and LSU) and inexplicable loss to Utah State.

Worst Team that Went to a Bowl: San Jose State 0.44
This distinction does not mean as much in the mid-major conferences where usually every bowl-bound team is deserving. Still, the Spartans were clearly a notch below the league's triumvirate.

Schedule Strength: No need to rank schedule strength since everybody plays everybody in the 9-team league.

Team(s) Likely to Decline: San Jose State and Boise State
The Spartans were and still are a great story under Dick Tomey. However, they were much closer to Fresno State and New Mexico State in SDPI ranking than Nevada, Boise State, or Hawaii. They do return their starting quarterback, running back, and 3/5ths of the offensive line, but they lose their top two receivers. The offense was also below average last season, and the unit that carried the team loses six starters. Expect a brief step back before more progress is made. Boise State is obviously due for a decline after their cinderella season. Jared Zabransky, both starting receivers, and the starting tight end are gone as are six defensive starters. The Broncos must also travel to both Hawaii and Fresno State so another WAC title is a dubious proposition.

Team(s) Likely to Improve: Fresno State and New Mexico State
After a trying 7-game losing streak culminating in three consecutive throttlings at the hands of Hawaii, LSU, and Boise State, the Bulldogs rebounded to win 3 of their last 4. Accoring to SDPI. they were bunched in the middle of the conference pack with San Jose State and New Mexico State, far below the top three, but also far above the bottom feeders. With a year of seasoning, Tom Brandstater should improve on his sophomore campaign and bring some consistency to the Bulldogs offense and they should return to a bowl game. Also don't expect another loss to Utah State. Hal Mumme has had two seasons to install his chuck n' duck offense at New Mexcio State and the Aggies should compete for a bowl game this season. They were a tough luck 0-4 in close games (0-2 in conference play) last season so should see some improvement in that department.. Quarterback Chase Holbrook returns for his senior season to try and out-stat Colt Brennan. Don't forget, although this is only Holbrook's second year at New Mexico State, he played for Mumme at SE Louisiana in 2004.

Best Chance to Crash the BCS: Hawaii
The Warriors get their main man Colt Brennan back after a brief flirtation with the NFL. They do lose their starting running back and two receivers to go along with three starting offensive linemen, so protection may be an issue especially against the better teams. The Warriors only lose three starters from the best defense in the June Jones era. However, keep an eye on how the defense performs minus defensive coordinator Jerry Glanville who is now the head coach at Portland State. All things considered, this is the Warriors best chance for a bowl game off the Islands. Thus far, the non-conference slate consists of a Mountain West also ran (UNLV) on the road and a mid-level Pac 10 team (Washington) at home. Boise State and Fresno State must come to the Islands so the game that must be circled on all Hawaii fan's calendars is 11/17 at Nevada. Of course, a great deal also depends on who the other three non-conference opponents turn out to be.

Tuesday, March 06, 2007

Pac 10 Rewind: SDPI


One way to look at team strength, taken from Eddie Epstein’s fantastic book Dominance, is to look at teams points scored and allowed relative to the league average and standard deviation. The more standard deviations they are from the mean, the better (or worse they are). For those unfamiliar with what standard deviation is here’s the wikipedia link. In the coming weeks, I will be looking at each Division IA conference and ranking each team in regards to their Standard Deviation Power Index in conference play. Keep in mind, the SDPI does not adjust for schedule strength for conferences such as the ACC where each team does not play each other and it ignores special teams which can play a significant role in both points scored and points allowed.

If you want the meat of the article, skip this next paragraph as it just gives an example of how the SDPI is calculated. The mean points scored and allowed for all Pac 10 teams in conference play was 201.8 points. The standard deviation for points scored was 57.64. The standard deviation for points allowed was 44.38. Cal scored 280 and allowed 173 points. Cal's offensive SDPI was 1.36 = ([280-201.8]/57.64). Their defensive SDPI was 0.65 = ([201.8-173]/44.38). Their total SDPI was 2.01. In the 2006 Pac 10, that was second best.

First here's the link to the 2006 Pac 10 Standings to refresh your memory.

Now here are the 2006 SDPI Standings:

Southern Cal 2.29
Cal 2.01
UCLA 0.67
Oregon State 0.54
Oregon 0.11
Arizona -0.08
Washington State -0.12
Arizona State -0.77
Washington -0.80
Stanford -3.84

With the exception of the top two and the bottom feeder, the Pac 10 was extremely balanced. The distance between the 3rd best team and the 10th best team was about the same as the distance between the 2nd and 3rd best team.

Best Offense: Cal 1.36
Jeff Tedford's Golden Bears were the most potent offense in the Pa 10.

Worst Offense: Stanford -2.22
Despite the presence of pro prospect Trent Edwards for half the season, the Cardinal could not put together a consistent offensive attack. They were held to single digits in 5 of their 7 conference games.

Best Defense: Southern Cal 1.60
The defense kept the Trojans on top of the Pac 10 while their new skill position players honed their craft.

Worst Defense: Stanford -1.63
The Cardinal double dip in both categories. Only held one team (Washington) below 20 points.

Best Team that Didn't Go to a Bowl: Arizona -0.08
The Wildcats were roughly the 6th best team in the conference and actually finished bowl eligible.

Worst Team that Went to a Bowl: Arizona State -0.77
As was normally the case under Dirk Koetter, the Sun Devils failed to live up to preseason expectations. They were much closer to Washington in terms of performance than Washington State.

Schedule Strength: No need to rank schedule strength since everybody plays everybody in the 9-team league.

Team(s) Likely to Decline: Oregon State
The Beavers lose their senior quarterback, Matt Moore, and should also see some regression in the luck department. They were 3-1 in close conference games, 5-1 overall. Hard to come up with any other teams that look like solid bets to decline, although some certainly will. Every other Pac 10 team has their fair share of positive and negative indicators. The Beavers are the only team where the negatives significantly outweigh the positives.

Team(s) Likely to Improve: Washington State and Arizona
Improvement is a must for these two squads if their respective coaches want to breathe easier. Washington State, which finished 8th in the SDPI rankings, was just as close to fourth place as they were to 9th. They return their starting quarterback, so with a little bit of luck, they should improve on their 4-5 conference record in 2006. Mike Stoops should finally have the Wildcats in a bowl game in his fourth year in the desert. The Wildcats return their starting quarterback, prize recruit Willie Tuitama, who must improve on his disappointing 2006 campaign. The Pac 10 is probably the hardest conference to project going forward because the middle seven teams were all bunched so close together. From each according to his ability, to each according to his needs.

Wednesday, February 28, 2007

Big 12 Rewind: SDPI


Before getting into the Big 12, head over to The Power T Blog. Doug's doing some stat work of his own, starting with the SEC.

One way to look at team strength, taken from Eddie Epstein’s fantastic book Dominance, is to look at teams points scored and allowed relative to the league average and standard deviation. The more standard deviations they are from the mean, the better (or worse they are). For those unfamiliar with what standard deviation is here’s the wikipedia link. In the coming weeks, I will be looking at each Division IA conference and ranking each team in regards to their Standard Deviation Power Index in conference play. Keep in mind, the SDPI does not adjust for schedule strength for conferences such as the ACC where each team does not play each other and it ignores special teams which can play a significant role in both points scored and points allowed.

If you want the meat of the article, skip this next paragraph as it just gives an example of how the SDPI is calculated. The mean points scored and allowed for all Big 12 teams in conference play (championship game not included) was 210.083 points. The standard deviation for points scored was 42.98. The standard deviation for points allowed was 52.14. Nebraska scored 236 and allowed 173 points. Nebraska's offensive SDPI was 0.60 = ([236-180.083]/42.98). Their defensive SDPI was 0.71 = ([210.083-173]/52.14). Their total SDPI was 1.31. In the 2006 Big 12, that was good for third best.

First here's the link to the 2006 Big 12 Standings to refresh your memory.

Now here are the 2006 SDPI Standings:

Texas 2.11
Oklahoma 1.66
Nebraska 1.31
Missouri 0.77
Oklahoma State 0.62
Texas A&M 0.29
Kansas 0.27
Texas Tech 0.22
Kansas State -0.67
Colorado -0.95
Baylor -2.48
Iowa State -3.09

Their two late season losses to Kansas State and Texas A&M cost the Longhorns a shot to win the Big 12. The top two and four of the top six teams were in the Big 12 South.

Best Offense: Texas 1.39
Freshmen Colt McCoy did his part to help keep the Longhorns at the top of the Big 12 heap.

Worst Offense: Iowa State -2.10
Despite returning their starting quarterback, running back, and leading receiver the Cyclones struggled mightily in Dan McCarney's final season. They broke the 20 point barrier only twice in conference play (Missouri and Texas Tech).

Best Defense: Oklahoma 1.71
Sooners had the league's best defense. A good thing because their offense was actually below average.

Worst Defense: Baylor -2.11
After they opened conference play holding Kansas State to 3 points, the Bears allowed at least 30 points in their next 7 conference games. Three teams broke 50 and two (Texas and Oklahoma State) broke 60.

Best Team that Didn't Go to a Bowl: Kansas 0.27
The Jayhawks did get to bowl eligibility at 6-6, but were not selected for postseason play. According to SDPI, they were the 7th best team in the conference, just a notch below Texas A&M.

Worst Team that Went to a Bowl: Kansas State -0.67
Aided by a 3-0 record in close games (2-0 in conference play) the Wildcats went bowling for the first time since 2003.

Toughest Schedule (ranked by sum of opponent's SDPI): Iowa State 4.66
The Cyclones drew both of the behemoths from the South (Texas and Oklahoma) and avoided Baylor.

Easiest Schedule (ranked by sum of opponent's SDPI): Kansas -4.26
The Jayhawks avoided Texas and Oklahoma from the South and drew Baylor (who they lost to).

Entire Schedule Strength (hardest to easiest):
Iowa State 4.66
Texas A&M 4.42
Baylor 3.55
Oklahoma State 2.71
Nebraska -0.71
Missouri -0.96
Texas Tech -1.13
Kansas State -1.50
Colorado -2.07
Texas -2.14
Oklahoma -2.57
Kansas -4.26

Team(s) Likely to Decline: Kansas State and Texas A&M
The Wildcats won 7 games last season thanks to luck (3-0 in close games) and great special teams play. Their offense and defense were both below average in Year One of the Ron Prince Era. Check the stats. Twice as many interceptions as touchdown passes? Allowed 58% of passes to be completed? The return game bailed these guys out a lot last season. Punt and or kickoff return touchdowns were the difference in the narrow victories over Illinois State and Oklahoma State. Relying on the return game to be as phenomenal as it was last year is a lot to ask. Couple some special teams regression with a tougher non-conference schedule (at Auburn, at Fresno State, and a home date with feisty San Jose State) and the Wildcats will very likely be spending the holidays in Manhattan. Seven of Texas A&M's eight conference games were decided by 6 points or less. The Aggies went 4-3 in those games. Any regression in the luck department and the Aggies could be looking down only at Baylor in the Big 12 South.

Team(s) Likely to Improve: Missouri, Kansas, and Oklahoma State
Only 6 on the conference's 12 teams have played in the Big 12 Championship Game: Nebraska, Colorado, and Kansas State from the North and Oklahoma, Texas, and Texas A&M from the South. That could change this season as these three teams should all improve. Missouri returns their terrific quarterback Chase Daniels and gets their biggest division foe Nebraska at home while avoiding at least one of the Southern Giants (Texas). Kansas also gets the Huskers at home and avoids both Oklahoma and Texas while once again drawing Baylor. Despite their 3-5 conference record last season, SDPI sees the Cowboys as the 5th best team in the conference. They were a tough luck 0-4 in close games in conference play. In 2007, their high powered offense returns both the starting quarterback, Bobby Reid, and his leading receiver Adarius Bowman. The Cowboys do draw two of the stronger teams from the North (Nebraska and Kansas), but if the 8-year reign of Sooner/Longhorn terror is to end in the South in 2007, the Cowboys will be the team to do it.

Saturday, February 24, 2007

SEC Rewind: SDPI


One way to look at team strength, taken from Eddie Epstein’s fantastic book Dominance, is to look at teams points scored and allowed relative to the league average and standard deviation. The more standard deviations they are from the mean, the better (or worse they are). For those unfamiliar with what standard deviation is here’s the wikipedia link. In the coming weeks, I will be looking at each Division IA conference and ranking each team in regards to their Standard Deviation Power Index in conference play. Keep in mind, the SDPI does not adjust for schedule strength for conferences such as the ACC where each team does not play each other and it ignores special teams which can play a significant role in both points scored and points allowed.

If you want the meat of the article, skip this next paragraph as it just gives an example of how the SDPI is calculated. The mean points scored and allowed for all SEC teams in conference play (championship game not included) was 166.83 points. The standard deviation for points scored was 36.46. The standard deviation for points allowed was 33.20. Arkansas scored 221 and allowed 134 points. Arkansas' offensive SDPI was 1.49 = ([221-166.83]/36.46). Their defensive SDPI was .99 = ([166.83-134]/33.20). Their total SDPI was 2.47 (difference due to rounding). In the 2006 SEC, that was good second, just a hair behind LSU.

First here's the link to the 2006 SEC Standings to refresh your memory.

Now here are the 2006 SDPI Standings.

LSU 2.54
Arkansas 2.47
Florida 1.54
Tennessee 1.08
Auburn 0.89
Georgia 0.46
South Carolina 0.08
Alabama -1.17
Kentucky -1.32
Mississippi -1.66
Vanderbilt -2.16
Mississippi State -2.75

Most folks will take one look at those numbers and immediately become close-minded since the third place team not only won the conference, but also the national championship. But remember, the Gators survived both Tennessee and South Carolina by one point apiece, Georgia by 7, and Vandy by 6. With a few bounces going the other way, the Gators historic season could have ended in the Outback Bowl.

Best Offense: Arkansas 1.49
The tandem of McFadden and Jones took the SEC by storm despite inconsistent play from the quarterback position.

Worst Offense: Mississippi -1.20
Even with Michael Oher, from The Blindside, a great book if you need some reading material, the Rebel offense struggled mightily. They broke 20 points only once in conference play--against Alabama.

Best Defense: Florida 1.29
Defense wins championships? Maybe so. Before the SEC Championship Game (which is not included) only one team broke 20 against them and that was on a defensive touchdown in the games final seconds.

Worst Defense: Mississippi State -1.66
Held two teams under 20 points, South Carolina and Alabama. Incidentally, the game against Alabama was their only win.

Best Team that Didn’t Go to a Bowl: Mississippi -1.66
This says more about the conference than the Rebels. When 9 of the conferences 12 teams play in the postseason, the teams that don't are usually pretty bad.

Worst Team that Went to a Bowl: Kentucky -1.32
The Wildcats were only marginally better than Mississippi, but benefited from the scheduling gods--two of their games against the SEC West were against dregs Mississippi and Mississippi State, and a close win over Georgia.

Toughest Schedule (ranked by sum of opponent’s SDPI): Tennessee 2.44
In their SEC West games, the Vols played the league's two best team (LSU and Arkansas) and Alabama while avoiding the weaker sisters (Mississippi and Mississippi State).

Easiest Schedule (ranked by sum of opponent’s SDPI): Georgia -4.30
Like Kentucky, they played the SEC West's two weakest teams (Mississippi and Mississippi State) and an Auburn team that was substantially worse than the West's top two teams.

Entire Schedule Strength (hardest to easiest)
Tennessee 2.44
Mississippi State 2.29
Alabama 1.95
Auburn 1.51
Vanderbilt 1.48
Florida 0.40
South Carolina 0.21
Kentucky -0.87
LSU -0.92
Mississippi -1.04
Arkansas -3.15
Georgia -4.30

Team(s) Likely to Decline: Kentucky, Arkansas, and LSU
The Wildcats were not nearly as good as their 4-4 conference record would portend. In 2007, only one of their home games looks winnable (Mississippi State). The others are against LSU, Florida and Tennessee. Their road games are against Arkansas, South Carolina, Vanderbilt, and Georgia. Kentucky will probably finish in the SEC East cellar. Unless Arkansas gets some much improved play from quarterback Casey Dick, expect the Hogs to fall to the middle of the pack in the SEC West. McFadden and Jones are still on the team, but the Hogs attack can't be as one-dimensional as last season if they want to get back to the SEC Championship Game. And don't forget about all the offseason drama--complete with forwarded emails, impromptu resignations, parental meetings, and transfers. Don't buy into the LSU=National Champion hype. The Tigers lost a key cog to their offense--JaMarcus Russell. As noted here and here, losing your starting quarterback hurts more than bringing him back helps.

Team(s) Likely to Improve: Alabama and South Carolina
The Tide were only 2-4 in close conference games last season so expect some improvement in that department. They return a very competent starting quarterback in John Parker Wilson. And some guy named Saban is now coaching the team. Saban will probably get too much credit for the turnaround as Bama had a lot of positive indicators for an improvement even if Shula remained the coach. Check the schedule too. Vandy, Mississippi, and Mississippi State as three of the four conference road games. Four tough teams (Arkansas, Georgia, Tennessee, and LSU) do come to Bryant-Denny, but the schedule is built for Bama to win the SEC West. Initially, I though South Carolina had a chance to win the East, what with Spurrier being in his third season with a stellar recruiting class. The schedule is just too tough to send the Gamecocks to Atlanta. Roadies at Georgia, LSU, Tennessee, and Arkansas and a home date with Florida is a lot to overcome. Their other three home games are likely wins (Mississippi State, Kentucky, and Vandy), so they will definitely improve on their 3-5 conference mark.

Monday, February 19, 2007

Big 10 Rewind: SDPI

One way to look at team strength, taken from Eddie Epstein’s fantastic book Dominance, is to look at teams points scored and allowed relative to the league average and standard deviation. The more standard deviations they are from the mean, the better (or worse they are). For those unfamiliar with what standard deviation is here’s the wikipedia link. In the coming weeks, I will be looking at each Division IA conference and ranking each team in regards to their Standard Deviation Power Index in conference play. Keep in mind, the SDPI does not adjust for schedule strength for conferences such as the ACC where each team does not play each other and it ignores special teams which can play a significant role in both points scored and points allowed.

If you want the meat of the article, skip this next paragraph as it just gives an example of how the SDPI is calculated. The mean points scored and allowed for all Big 10 teams in conference play was 186 points. The standard deviation for points scored was 52.90. The standard deviation for points allowed was 70.08. Penn State scored 135 and allowed 117 points. Penn State's offensive SDPI was -0.96 = ([135-186]/52.90). Their defensive SDPI was .98 = ([186-117]/70.08). Their total SDPI was 0.02. In the 2006 Big 10, that was good for fourth best.

First here's the link to the 2006 Big 10 Standings to refresh your memory.

Now here are the 2006 SDPI Standings.

Ohio State 3.59
Wisconsin 2.11
Michigan 1.68
Penn State 0.02
Purdue -0.30
Iowa -0.31
Minnesota -0.51
Illinois -1.07
Michigan State -1.50
Indiana -1.79
Northwestern -1.92

The 2006 Big 10 was the epitome of football stratification. Ohio State, Wisconsin, and Michigan were head and shoulders above the rest of the league. In fact, the difference in SDPI between Michigan (3rd best) and Penn State (4th best) was greater than the difference between Penn State and Michigan State (9th best).

Best Offense: Ohio State 2.25
Before he melted down in the BCS Championship Game, Troy Smith was a beast in Big 10 play, throwing 20 touchdown passes and just 5 interceptions en route to winning the Heisman. Of course, don't forget the other fabulous skill position players: Antonio Pittman, Ted Ginn Jr., and Anthony Gonzalez to name a few.

Worst Offense: Northwestern -1.15
After averaging 31.6 points per game in Big 10 play in 2005, the Wildcats averaged only 15.6 per game in 2006. Only 3 times did they score more than 10 points (Michigan State, Iowa, and Illinois). Perhaps not coincidentally, they won two of those games.

Best Defense: Ohio State 1.34
Gave up only 92 points in conference play, with 39 coming in the season finale against Michigan.

Worst Defense: Indiana -1.66
5 of their 8 conference foes broke 30 and all 8 broke 20.

Best Team that Didn’t Go to a Bowl: Illinois -1.07
Despite finishing in the Big 10 cellar, the Illini were actually the 8th best team in the conference.

Worst Team that Went to a Bowl: Minnesota -0.51
After a miserable start in Big 10 play (0-5 and outscored by an average of over 20 per game), the Gophers won their final 3 (all by at least 10 points) to become bowl eligible.

Toughest Schedule (ranked by sum of opponent’s SDPI): Northwestern 4.22
Wildcats played the top 6 SDPI teams in the conference and 8 of the top 9. Only way the schedule could have been tougher would be to replace Michigan State with Minnesota.

Easiest Schedule (ranked by sum of opponent’s SDPI): Ohio State -5.40
Played the bottom 6 SDPI teams and avoided Wisconsin. However, their schedule rating is so low primarily because they didn't have to play themselves. Dominated the league, so take their schedule rating with a grain of salt.

Entire Schedule Strength (hardest to easiest)
Northwestern 4.22
Indiana 3.69
Minnesota 3.50
Penn State 2.08
Iowa 1.79
Illinois -0.10
Michigan State -0.30
Michigan -0.31
Wisconsin -4.20
Purdue -4.97
Ohio State -5.40

Team(s) Likely to Decline: Ohio State, Purdue, and Indiana
Buckeyes simply lose too much to repeat as Big 10 champs. Have to go on the road to Michigan and Penn State in 2007. Every 3 years, Buckeyes seem to fall down a notch--2001 7-5 before consecutive 11+ win seasons, 2004 8-4 before consecutive 10+ win seasons. Time for the Boilermakers to pay the piper. After avoiding Michigan and Ohio State in 2005 and 2006, while compiling only 5-6 and 8-6 records, the Boilers get them both to go along with tough road games at Penn State and Minnesota. Hoosiers actually finished tied for 6th in the Big 10 with 3 conference wins, but according to SDPI were actually only better than Northwestern. Despite nearly becoming bowl eligible, Hoosiers have farther to go than most observers believe.

Team(s) Likely to Improve: Illinois and Michigan State
The Illini had terrible luck in close games last season (1-4) and were actually the 8th best team in the conference. Couple that with a few strong recruiting classes and the Zooker will have them back in a bowl game for the first time since their Sugar Bowl appearance in 2001. Spartans were also a tough luck 1-4 in close games so expect some improvement in that area. Also not coached by a complete maniac so they have that going for them.

Tuesday, February 13, 2007

Big East Rewind: SDPI

One way to look at team strength, taken from Eddie Epstein’s fantastic book Dominance, is to look at teams points scored and allowed relative to the league average and standard deviation. The more standard deviations they are from the mean, the better (or worse they are). For those unfamiliar with what standard deviation is here’s the wikipedia link. In the coming weeks, I will be looking at each Division IA conference and ranking each team in regards to their Standard Deviation Power Index in conference play. Keep in mind, the SDPI does not adjust for schedule strength for conferences such as the ACC where each team does not play each other and it ignores special teams which can play a significant role in both points scored and points allowed.

If you want the meat of the article, skip this next paragraph as it just gives an example of how the SDPI is calculated. The mean points scored and allowed for all Big East teams in conference play was 172.25 points. The standard deviation for points scored was 58.22. The standard deviation for points allowed was 37.97. Cincinnati scored 152 and allowed 141 points. Cincinnati’s offensive SDPI was -0.35 = ([152-172.25]/58.22). Their defensive SDPI was .82 = ([172.25-141]/37.97). Their total SDPI was 0.48 (not 0.47 because the other two were rounded). In the 2006 Big East, that was good for fifth best.

First here's the link to the 2006 Big East Standings to refresh your memory.

Now here are the 2006 SDPI Standings.

Louisville 2.11
West Virginia 1.13
Rutgers 0.86
South Florida 0.57
Cincinnati 0.48
Pittsburgh -0.92
Syracuse -1.93
Connecticut -2.29

Not much difference in the actual standings and the SDPI standings.

Best Offense: West Virginia 1.49
Pat White, Steve Slaton, and Mountaineers’ spread option were the best offense in the Big East.

Worst Offense: Syracuse -1.57
The most points they scored in conference play was 20. Held to 17 or less in their other 6 conference games.

Best Defense: South Florida 1.03
Held every opponent except Louisville to 20 points or less.

Worst Defense: Connecticut -1.73
All you need to know: The Orangemen scored 20 on their defense.

Best Team that Didn’t Go to a Bowl: Pittsburgh -0.92
This says more about Pitt’s non-conference slate than anything (Citadel). Lost their last 5 games to finish 6-6.

Worst Team that Went to a Bowl: Cincinnati 0.48
Hardly an indictment of their team as the Bearcats had a solid season that included a near miss against Louisville and beatdowns of South Florida and undefeated Rutgers.

Schedule Strength: No need to rank schedule strength since everybody plays everybody in the 8-team league.

Team(s) Likely to Decline: Pittsburgh and Louisville
The Panthers can’t blame lousy luck in close games like they could in 2005 for their sub-par record. The Panthers couldn’t post bowl bids in Wanny’s first two years with Tyler Palko, so chances are they won’t in the first year AP. The Cards should be good yet again, but losing Petrino will hurt, as will road trips to West Virginia, South Florida, and Cincinnati.

Team(s) Likely to Improve: South Florida and Syracuse
As long as Matt Grothe stays healthy the Bulls will be a sleeper team in the Big East. They get the two big boys (West Virginia and Louisville) as well as Cincinnati at their place. Despite their offensive struggles, Syracuse was actually not the worst team in conference play last year. If their offense improves at all (and it may with Perry Patterson graduating) the Orangemen could finish a little higher in the standings.

Thursday, February 08, 2007

ACC Rewind: SDPI

One way to look at team strength, taken from Eddie Epstein’s fantastic book Dominance, is to look at teams points scored and allowed relative to the league average and standard deviation. The more standard deviations they are from the mean, the better (or worse they are). For those unfamiliar with what standard deviation is here’s the wikipedia link. In the coming weeks, I will be looking at each Division IA conference and ranking each team in regards to their Standard Deviation Power Index in conference play. Keep in mind, the SDPI does not adjust for schedule strength for conferences such as the ACC where each team does not play each other and it ignores special teams which can play a significant role in both points scored and points allowed.

If you want the meat of the article, skip this next paragraph as it just gives an example of how the SDPI is calculated. The mean points scored and allowed for all ACC teams in conference play (championship game not included) was 162 points. The standard deviation for points scored was 35.97. The standard deviation for points allowed was 51.18. Coastal Division champ Georgia Tech scored 213 and allowed 155 points. Georgia Tech’s offensive SDPI was 1.42 = ([213-162]/35.97). Their defensive SDPI was .14 = ([162-155]/51.18). Their total SDPI was 1.55 (not 1.56 because the other two were rounded). In the 2006 ACC, that was good for third best.

First here's the link to the 2006 ACC Standings to refresh your memory.

Now here are the 2006 SDPI Standings.

Virginia Tech 2.02
Clemson 1.81
Georgia Tech 1.55
Boston College 1.32
Wake Forest 0.69
Florida State 0.42
Virginia -0.15
Miami -0.29
Maryland -0.45
NC State -0.93
North Carolina -2.63
Duke -3.36

If you thought Wake Forest was doing it with smoke and mirrors, well you were probably right. SDPI has Wake Forest as an above average, but middling team (5th place in the league). The league’s best team, according to SDPI, did not get to participate in the title game thanks to their mid-season struggles. Although 3 of the 4 Tobacco Road schools finished with at least 6 losses, its clear North Carolina and Duke were in a league of their own in terms of ineptitude.

Best Offense: Georgia Tech 1.42
Despite the best efforts of Reggie Ball the Yellow Jackets did post the league’s best offensive SDPI.

Worst Offense: North Carolina -1.47
Yes they were worse than Duke.

Best Defense: Virginia Tech 1.35
In their last 4 conference games, the Hokies gave up 23 points.

Worst Defense: Duke -2.31
Held only one team to under 20 points (Wake Forest) and still lost thanks to a blocked field goal. Interestingly, the best and worst from each category all came from the Coastal Division.

Best Team that Didn’t Go to a Bowl: Virginia -0.15
The Cavs were 4-4 in the ACC (about what you would expect given the almost average ranking), but failed to go bowling thanks to a 1-3 mark in non-conference play.

Worst Team that Went to a Bowl: Maryland -0.45
All 5 of their conference wins came by 6 points or less, including two by a single point, one by two, and one by three.

Toughest Schedule (ranked by sum of opponent’s SDPI): Maryland 4.42
Maybe that’s why they played so many close games. No Hokies, but also no Heels or Devils on the schedule.

Easiest Schedule (ranked by sum of opponent’s SDPI): Georgia Tech -3.98
Jackets had the easiest schedule and won their division. Coincidence? Played the Atlantic’s best (Clemson), but also the two worst (Maryland and NC State).

Entire Schedule Strength (hardest to easiest)
Maryland 4.42
Duke 2.93
NC State 2.56
Clemson 1.99
North Carolina 1.34
Boston College -0.09
Virginia Tech -1.06
Miami -1.28
Florida State -1.36
Wake Forest -1.80
Virginia -3.67
Georgia Tech -3.98

Team(s) Likely to Decline: Wake Forest and Maryland
The Deacs are not going to win the ACC again next year obviously, but should be competitive and go to a mid-level bowl game. Maryland’s unbelievable luck in close games will not continue and don’t be shocked to see The Fridge’s boys in the Atlantic basement next season.

Team(s) Likely to Improve: Virginia and NC State
The Cavs were a very young team in 2006, but were still actually about average. Expect 2007 to be Groh’s best in Charlottesville. NC State finished 2-6, but they were much closer to Maryland in terms of SDPI than either of their basement brethren on Tobacco Road. Tom O’Brien was a great hire and NC State will contend for a bowl game in 2007.

Sunday, February 04, 2007

Super Bowl Thoughts


Even though this has evolved into a college football blog, it's the Super Bowl. So for those who care, these are my thoughts.

1. Even though the Bears played in the weaker conference, people still seem to forget they had a better record (13-3 versus 12-4) and a better point differential (+172 versus +67) than the Colts.

2. The Colts were 10-0 in the RCA Dome this season, but a more pedestrian 5-4 away from home. This game is not at Soldier Field, but the Colts chances of winning are much closer to 56% than 100%. The Bears were 7-1 on the road if you were wondering.

3. The Bears defense has not been the same since the Tommie Harris injury in game 12. In the first 12 games they gave up 12.5 points per game. In the last six they have given up 23.8 per game.

4. The Colts defense that has played reasonably well in the playoffs (very well before the New England game) still got shredded for 173 yards per game on the ground and allowed an average of 5.33 yards per carry.

5. Peyton Manning is a better quarterback than Rex Grossman. John Elway was better than Doug Williams. Fran Tarkenton was better than Ken Stabler. Roger Staubach was better than Terry Bradshaw. Jim Kelly was better than both Jeff Hostetler and Mark Rypien. 52 other guys on each team will have a say in how this game turns out.

6. The Colts coverage units are awful. Their punt coverage units finished 31st in the league allowing 13.1 yards per return. Their kickoff coverage was not much better ranking 30th while allowing 26 yards per runback. Chicago led by Devin Hester, finished 2nd in punt return average (12.1 per return) and 8th in kickoff return average (23.3). And remember, the last time a special teams player won the Super Bowl MVP, his initials were also DH.

While the Bears may not win this game, odds are they will be very competitive. That 7 point spread is a lot to lay if you're a Colts backer. Here's my prediction. I won't give you a winner, but I'll take the Bears +7 any day.

Saturday, February 03, 2007

Does the Better Team Usually Win Close Games?

I'm taking a brief sabbatical from the quarterback question (I'll have the splits for BCS versus non-BCS teams shortly) and focusing on an old reliable: close games. What I want to know is: How often (at least in 2006) did the 'better' team win a close ball game (decided by 8 points or less)? Now defining better will get you in a ton of trouble, but I've decided to try and do it anyway. For the purpose of this analysis, I'm looking at each team's record outside the game in question. Now of course, this ignores schedule strength and a host of other variables including when the game was played. Some teams improved dramatically over the course of the season (Arkansas and Wake Forest) and some teams fell apart (Clemson). Still, its a quick and easy measure and it can tell us a little something about team strengths. If the teams have the same record outside of their close game then it gets ignored. For example, in a Week 1 game that broke the TV ratings record set by M*A*SH, Buffalo beat Temple 9-3 in overtime. Buffalo finished the season 2-10, while Temple finished 1-11. Outside of that game, both teams were 1-10, so they are treated as being roughly equal and the game is not counted. In addition, the team's record outside of the close game must be more than 1/2 a game different, in order to adjust for the varying season length of each team's schedule which can include bowl, conference title, and/or Hawaii games. For example, in mid-October, Alabama beat Ole Miss 26-23. Alabama finished the season 6-7 after losing their bowl game. Ole Miss did not play in a bowl game and finished 4-8. Outside of their game against each other, Alabama was 5-7 and Ole Miss was 4-7. Since the difference is only 1/2 game, this game is also ignored and the teams are treated as equals.

In 224 games decided by 8 points or less. where there was at least a game difference between the teams outside of the close game, the 'better' team had a cumulative record of 139-85. The 'better' team won a close game a little more than 62% of the time in 2006. That seems like a pretty strong majority, and it would be in a presidential elections. But look at it the other way. The weaker team has a 38% chance (better than 1 in 3) of pulling off the upset. Most underdogs would gladly take those odds.

Finally, here's a theoretical example. Say your a pretty good team in a BCS conference. Let's go ahead and assume your the best team in your BCS conference. But your conference is very strong (say like the SEC in 2006) and you have to play three teams, that while a notch below you are still pretty good. And each of those games turns out to be a nail-biter. The odds that you win everyone of those games is just 23.9% (.62 ^3). And what about that road game against a decent team where you took them lightly and they played you tight deep into the fourth quarter. Odds that you win all 4? 14.8% (.62 ^4). The point I'm trying to hammer home yet again, is that close games have a lot to do with lady luck. Even when you are the better team, the fates can intervene and hand you a close loss.

Sunday, January 28, 2007

More on Returning Quarterbacks


A few days ago, I took a look at how teams who returned their starting (or at least experienced)quarterback performed compared to teams that did not in 2006. First I looked at overall records. However, those can be misleading for several reasons. First and foremost, all teams played at least 12 regular season games in 2006. Teams that played in bowl games could play up to 14 games. The most games any team played in 2005 was 13 games. Often times this extra game is a non-conference cup cake against a Sun Belt or non-Division IA school. To make the comparison more fair, this time we will look at each team's record only in conference games. With the big time conferences having as many as 12 teams, this is not totally unbiased because some teams can still have substantially easier conference slates based on since they do not play everyone in the conference. Still, 2006 is a good year to examine this phenomenon because no teams changed conferences between 2005 and 2006, keeping ot such lurking variables as conference strength. For example, it would not be fair to look at compare conference records between 2004 and 2005 because a number of teams changed conferences (Boston College went from a watered down Big East to the ACC, while Cincinnati, Louisville, and South Florida went from Conference USA to a BCS league, TCU went from Conference USA to the Mountain West, SMU, Rice, UTEP, and Tulsa went from the WAC to Conference USA, and Central Florida and Marshall went from the MAC to Conference USA). I think that covers them all. Some final notes: Conference title games are excluded so that teams from the same conference all have the same number of games played, and 4 independents (Notre Dame, Army, Navy, and Temple) are not included in this data set. With that out of the way, here is how the two groups of teams performed.

The teams (62 total) that returned an experienced quarterback (at least 100 pass attempts the previous season) and had him play significantly (at least 100 pass attempts this season) in 2006 went a collective 238-248 in conference play in 2005. This is a winning percentage of .490 and equates to just under a 4-4 record (3.91-4.09) in a standard 8 game conference season. In 2006, those same teams improved to 269-223 in conference play. This is a winning percentage of .547 and equates to a 4.37-3.63 record in a standard 8 game conference season. This is an improvement of roughly 1/2 game in the conference standings.

The teams (53 total) that did not return an experienced quarterback in 2006 went a collective 214-204 in conference play in 2005. This is a winning percentage of .512 and equates to a conference record of 4.10-3.90 in a standard 8 game conference season. In 2006, those same teams regressed to 188-234 in conference play. This is a winning percentage of .445 and equates to a conference record of 3.56-4.44 in a standard 8 game conference season. This is a regression of a little more than 1/2 game in the conference standings.

21 teams (33.9%) that returned an experienced quarterback improved by at least 2 games in the conference standings. 8 teams (12.9%) improved by at least 3 games in the conference standings. 13 teams (21%) declined by at least 2 games in the conference standings. 5 teams (8.1%) declined by at least 3 games in the conference standings.

10 teams (18.9%) that did not return an experienced quarterback improved by at least 2 games in the conference standings. 5 teams (9.4%) improved by at least 3 games in the conference standings. 21 teams (39.6%) declined by at least 2 games in the conference standings. 10 teams (18.9%) declined by at least 3 games in the conference standings.

Those are the results. Dissect them at your leisure. I will say this, it appears that it may not be as valuable to return your starting quarterback (12.9% that returned theirs improved by at least 3 games and 9.4% that did not improved by at least 3 games) as it is damaging to have him leave (more than double the chance--18.9% to 8.1% of declining by at least 3 games). As promised, in a few more days, I'll look at how BCS and non-BCS schools compare when they return and lose their quarterback.

Wednesday, January 24, 2007

How Important is the Quarterback Position in College Football?


Way back in August, I made a bet, or a wager if you will, with a friend of mine. Now my friend happens to be a huge Clemson supporter. Our bet was simple: If Clemson won 10 games, I would be forced to pay up, and if Clemson did not win 10 games, he would be forced to pay up. My main rationale for going against the Tigers despite a favorable schedule, was that they would be breaking in a new starting quarterback. After manning the position for what seemed like a decade, Charlie Whitehurst had been drafted by the San Diego Chargers and a senior named Will Proctor would be taking over. Clemson began the season 7-1, but imploded down the stretch thanks in part to the lackluster play of their signal caller. Certainly the defense and special teams were also to blame, but Proctor played poorly in two of the losses (Virginia Tech and Maryland) and for over 3 quarters in the bowl game against Kentucky.

What I want to do is see what happens to teams that break in a new starting quarterback. To do this I divided all 119 Division IA teams into two groups. Those that returned 'experienced' quarterbacks and those that did not. I defined an experienced quarterback as one that threw at least 100 passes in the preceding season (2005). Additionally, those quarterbacks also had to have significant playing time in 2006, lest their experience just rot on the bench. So teams that are coded as 'experienced' had the same quarterback throw at least 100 passes in both 2005 and 2006. I know 100 is just an arbitrary cutoff point, but it had to be somewhere. 63 teams returned experienced quarterbacks this past season and 56 did not. Here's what happened.

Teams with a returning experienced quarterback had a collective record of 375-357 (.512) in 2005. When their experienced quarterbacks returned in 2006, their combined record jumped to 469-337 (.582). That's an increase of roughly 7 percentage points in winning percentage.

Teams who lost their quartebacks after 2005 had a collective record of 341-309 (.525) in 2005. When they lost their quarterbacks, they regressed to a combined 316-384 (.451) in 2006. That's a decrease of roughly 7.4 percentage points in winning percentage. Interesting how the gain in winning percentage among teams that returned their quarterback is almost equal to the losses in winning percentage of teams that lost their quarterback.

Here's more fuel to the fire that returning your quarterback is very important. Random fluctuation is common in sports, so there is not a great deal of difference in a team going 7-5 one season and 6-6 the next, at least in the quality of play. However, for teams that return an experienced quarterback, there is a very good chance they will improve by at least two games. 23 of the 63 teams (36.5%) improved by at least two games in 2006. To be fair, nearly a fourth, 14 of the 63 teams (22.2%) regressed by more than 1 game (at least one and a half games). Since schedule length varies in college football with conference title games, bowl games, and the 'extra' Hawaii games, an example for a one and a half game difference would be going 8-4 one year and 7-6 the next (1 in the win column and 2 in the loss column).

For teams that had to start over at the quarterback position, only 9 of 56 (16%) improved by more than two games in 2006. Plus a whopping 25 of the 56 teams (44.6%), or more than double the percentage for teams that returned an experienced quarterback, declined by more than 1 game.

That's all for now. Stay tuned unil this weekend or early next week, when we'll look at conference record (perhaps a better indicator of team strength with no Texas State cupcakes) for teams that do and do not return experienced quarterbacks as well as a comparision in what happens to BCS and mid-major schools when they lose quarterbacking experience.

Saturday, January 13, 2007

Ranking the SEC Coaches

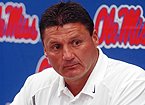
1-2-3-4. We lost to Wake Forest by 24.

I got dressed all by myself today.

Recently my friend and I got into a discussion about college coaches and we soon realized how loaded the SEC is with quality coaches. Every coach in the league with the exception of the above pictured gentlemen have a pretty good track record when it comes to coaching em' up, either at their current school or somewhere in the recent past. Now to be fair, both Ed Orgeron and Sylvester Croom stepped into tough situations at their respective universities. And if you believe what you read, Orgeron is a great recruiter so maybe Ole Miss will rise up in the near future. Croom's teams have improved (at least in regard to point differential) every season so maybe the Bulldog faithful have hope too. However, since those two have the least impressive credentials, I'm leaving them out of the discussion. Below the other ten coaches in the SEC are listed alphabetically along with their resumes.

Rich Brooks
22 seasons
Record: 106-141-4 .430
Brooks’ winning percentage is not that good, but he has taken Oregon and Kentucky (two programs that were not exactly elite when he got there) to 5 combined bowl games, going 2-3. He also won a conference title at Oregon in 1994, the schools first conference title in 37 years.

Phillip Fulmer
14.5 seasons
Record: 137-41 .770
Fulmer has had only one losing season in his 14+ seasons in Knoxville. He has won a national title (1998) as well as two conference titles and 4 SEC Eastern Division titles. He has taken the Vols to 14 bowl games going 7-7.

Bobby Johnson
13 seasons
Record: 73-77 .487
Johnson has made the Vanderbilt program competitive. His teams were a combined 6-29 his first three seasons, but have made strides the past two seasons going 5-6 (narrowly missing out on a bowl) and 4-8. Two seasons ago they beat Tennessee for the first time since Reconstruction and this past year they upset Georgia in Athens. Johnson was 58-34 (.630) in 8 seasons at Furman. He won one conference title, made 4 playoff appearances, and participated in the national championship game in his final season (2001).

Urban Meyer
6 seasons
Record: 61-12 .836
Meyer just won the national championship at Florida in only his second year. His teams have never lost more than 3 games in any one season. He has taken his teams to 4 bowl games, never losing a single one. He has 3 conference titles and the first ever BCS bowl appearance by a program outside the BCS leagues.

Les Miles
6 seasons
Record: 50-25 .667
Miles spent 4 years at Oklahoma State rebuilding that program and just finished his second season at LSU maintaining that program’s status as one of college football’s elite. His only losing season was his first in Stillwater. His teams have gone to 5 bowl games, winning 3, and he has an SEC Western Division title.

Houston Nutt
14 seasons
Record: 102-67 .604
Nutt has taken the Razorbacks to 7 bowl games in 9 years, winning two of them, and also taking two SEC Western Division titles. Prior to coming to Fayetteville, he spent 4 seasons at Murray State amassing two playoff appearances. He also spent one year (1997) at Boise State, coaxing the Broncos to a 4-7 record in only their second year of play in Division IA.

Mark Richt
6 seasons
Record: 61-17 .782
Richt has never had a losing season at Georgia nor has he lost more than 4 games in any one season. The Dawgs have gone to 6 bowl games (4-2 record), and have 3 SEC Eastern Division tiles to go along with 2 wins in the SEC Championship Game.

Nick Saban
11 seasons
Record: 91-42-1 .683
Little Nicky has never had a losing season and has coached his teams 9 bowl games where they have posted a 4-5 record. He has 2 SEC Western Division titles and 2 wins in the SEC Championship game. He also won a MAC Championship in his only year at Toledo. Oh and he won it all in 2003.

Steve Spurrier
17 seasons
Record: 157-50 .756
Spurrier has had but one losing season in his career (his first year at Duke). He also won a conference championship at Duke to go along with the 6 he won at Florida. His teams have gone to 14 bowl games winning 8. He also won Florida’s first (and until this season only national title) in 1996.

Tommy Tuberville
12 seasons
Record: 96-49 .662
Tuberville has had just two losing seasons in his 12 years roaming the sidelines at Ole Miss and Auburn. His teams have participated in 8 bowl games, winning 5. He has 2 SEC Western Division titles and one win in the SEC Championship Game. He also had an undefeated season in 2004, but did not get to participate in the BCS title game (Orange Bowl) because there were 3 undefeateds that season. He’s 6-2 against archrival Alabama (including 5 straight wins). And his record since 2000 is 66-23 (.742).

Now, I'm leaving it up to you. Who is the SEC's best coach? Use any definition of coaching you want (getting the best out of what you have, best X's and O's guy, best winning percentage, most wins, best Under Armor commercials, etc.) and let me know how you would rank these 10 gentlemen.

Tuesday, January 09, 2007

Championship Game Fall-Out


Well, that went about as expected. Not even the most ardent UF supporter could have seen that coming. If you introduced one of your foreign friends to this game and told them before hand that one team had the Heisman winner, one of the nation's top defense, a very good big game coach, and an undefeated record while the other team had a somewhat shaky quarterback, an offense that couldn't generate much offense against good teams, a very good defense themselves, and a good record built up by several close wins here's guessing they would have thought Florida was the undefeated team and Chris Leak was the Heisman winner. Ohio State would have been the team with the shaky offense, and Troy Smith would have been, well Reggie Ball? Smith's final stat line read 4-14 for 35 yards and one pick. In backyard football, those numbers will only net you two first downs.

Sporting events like this are good because they let you know a few things. First, you can never know everything there is to know about football. Every day you learn just a bit more. Secondly, statsitcis can only tell you so much. Every stat in the book predicted an OSU win, if not a blowout. Yet, the Gators were the team that thoroughly dominated--and yes they dominated, the Buckeyes. They held OSU to 82 total yards and one offensive touchdown. This wasn't a New England Patriots/St. Louis Rams upset where the underdog held on for dear life to win down the stretch. No the Gators dominated from just after the opening kickoff. You would have made a ton of money laying 27 points for the Gators about 16 seconds into the game after Ted Ginn Jr. ran the opening kick back.

Why didn't we see this coming? Florida barely survived Vanderbilt and South Carolina, yet here they were marching up and down the field on Ohio State while stifling their vaunted offense. Everyone knew the Gators came in with a superb defense, but to suggest beforehand they would humble the Buckeyes in this manner was unimagineable. Was it the month Urban Meyer had to prepare that made the Gators so unstoppable? Was it Tressel's refusal to adjust his defensive strategy? The Buckeye defensive backs were hardly ever in the picture when Florida snapped the ball allowing countless short completion after short sompletion. Was it motivation? Did Ohio State get full of its own hubris? Were the Gators bristling from all the disrespect that they were unbeatable? Probably a combination of all these things and a few others. The important thing is that although this site is called Statistically Speaking, sometimes statistics just get it wrong. I saw the Gators as a flawed offensive team that squeaked by several mediocre at best foes. And the Gators may still yet have to pay the piper for all their close wins. I saw the Buckeyes as a great team that obliterated everyone in their path. Statistics aren't perfect, just a tool for making rational decisions. Picking Ohio State to win this game was a very rational decision, but as they say: That's why you play the game.