Sunday, May 27, 2012

2012 MAC SDPI

Our SDPI look back is almost complete. Just two more conferences to go. This week, we'll tackle the MAC, a conference that has been stuck on 13 teams for five seasons with the addition of Temple in 2007. Just when it looked like they would have an even number for 2012 with the addition of Massachusetts, Temple bolts to the Big East. To see last year's MAC SDPI post, click here.

This first paragraph will explain how SDPI is calculated. So if you want the meat of this article skip on down. In the 2011 MAC regular season, conference play only, championship game excluded, the average MAC team gained and allowed 3217.385 yards. The standard deviation for yards gained (offense) was 658.88 yards. The standard deviation for yards allowed (defense) was 493.54 yards. Ohio gained 3713 yards and allowed 2971 yards. Their offensive SDPI was 0.75 = [(3713-3217.385)/658.88]. Their defensive SDPI was 0.50 = [(3217.385-2971)/493.54]. Their total SDPI was 1.25. This number ranked 3rd in the MAC.

Here are the 2011 MAC standings.

Now here are the 2011 MAC SDPI standings. The standings are sorted by division, by total SDPI with ranking for each category (out of 13 teams) in parentheses.

Ohio won the MAC East for the third time in seven seasons under Frank Solich, but failed yet again in their attempt to win the conference for the first time since 1968. Instead, Northern Illinois was your league champion, following up an 8-0 regular season with a 7-1 campaign and a second consecutive appearance in the MAC Championship Game.

So Who Was Better Than Their Record Showed?
Miami of Ohio followed up their MAC championship with a middling 3-5 conference record. After riding a close game hot streak (5-0 in one-score league games) to (relative) glory in 2010, their luck regressed and the Redhawks managed just a 1-3 mark in one-score MAC games in 2011. Couple that with the fact that they were forced to play three of the conferences top-four teams (Toledo, Ohio, and Temple) on the road, and the Redhawks record is just a tad misleading. For good measure, they also faced three BCS conference foes (Cincinnati, Minnesota, and Missouri) outside the MAC, further depressing their overall mark.

So Who Was Worse Than Their Record Showed?
After enjoying success at the IAA level at Lehigh and Elon, Pete Lembo guided Ball State to their first non-losing season (and a win over Indiana) since 2008 in his maiden voyage with the Cardinals. Unfortunately, much of that success may not be immediately sustainable in the near-term. The Cardinals won each of their four conference games by four points or less (combined margin of 12 points). In one of their league losses, they fell by 42. Over their eight MAC games, Ball State was outscored by 60 points. Teams with a similar scoring margin only win about a quarter of their games instead of half. Don't be surprised if the Cardinals are not able to Lembo quite as well in 2012.

Conference Superlatives:

Best Offense: Toledo 1.51
After being held to 305 yards in their MAC opener against Temple, the Rockets blasted off, never gaining fewer than 456 yards over the rest of the conference season. Their best performance came when they obliterated Western Michigan to the tune of 804 yards and 66 points in an exciting mid-week game.

Worst Offense: Akron -1.70
Zips is their nickname and the number of touchdowns their offense scored in three league games (zero touchdowns versus Temple, Miami, and Kent State).

Best Defense: Kent State 1.36
The Golden Flashes held six of their eight MAC opponents below 400 yards. Unfortunately, their offense was nearly as weak as their defense was strong. This was especially true when the Golden Flashes lost a game during which they allowed 166 total yards!

Worst Defense: Ball State -1.94
Six league opponents gained at least 500 yards against the Cardinals, and their last seven league opponents averaged 545 yards against them!

The LeFevour and the Cure
Central Michigan had a pretty good run under quarterback Dan LeFevour. With the dual-threat quarterback (or Rust Belt Tim Tebow if you prefer), the Chippewas went 27-4 against the rest of the MAC from 2006-2009, won three MAC titles, two bowl games, and culminated his senior campaign with a 12-2 season and AP top-25 finish. However, since LeFevour matriculated, the wins have been much harder to come by. The Chippewas have gone just 4-12 against the rest of the MAC and have put head coach Dan Enos squarely on the hot seat. Certainly, the offense has declined without the stud under center, falling from first in offensive SDPI in 2009 to fifth in both 2010 and 2011. However, the offense, while weakened has still been above average both seasons. The real culprit has been the disappearance of the defense. When the Chippewas were rolling through the MAC unbeaten in 2009, the defense ranked second in SDPI. The past two seasons, which have seen a pair of 2-6 league finishes, the Chippewas have finished 10th and 11th (out of 13 teams) in defensive SDPI. Digging a little deeper, the decline has been the primary result of a pass defense that has gone from very good to atrocious. The following table lists the passing numbers put up by MAC teams when facing the Central Michigan defense the past three seasons.
In 2009, the Chippewas allowed only seven passing touchdowns all season and just over six yards per pass attempt. In the next two seasons, they allowed 30 touchdown passes (against just eight interceptions) while allowing over seven and then over eight yards per pass attempt. If Central Michigan has designs on returning to the top of the MAC, they needn't find the next Dan LeFevour, but they must find a way to corral opposing receivers.

Sunday, May 20, 2012

2012 Sun Belt SDPI

Continuing on our mid-major tour, this week we examine the youngest Division IA conference, the Sun Belt. To see last year's SDPI recap of the Sun Belt, click here.

This first paragraph will explain how SDPI is calculated. So if you want the meat of this article skip on down. In the 2011 Sun Belt regular season, conference play only, the average Sun Belt team gained and allowed 3030.667 yards. The standard deviation for yards gained (offense) was 454.44 yards. The standard deviation for yards allowed (defense) was 415.54 yards. Western Kentucky gained 3081 yards and allowed 2875 yards. Their offensive SDPI was 0.11 = [(3081-3030.667)/454.44]. Their defensive SDPI was 0.37 = [(3030.667-2875)/415.54]. Their total SDPI was 0.49. This number ranked 4th in the Sun Belt.

Here are the 2011 Sun Belt standings.

Now here are the 2011 Sun Belt SDPI standings. The standings are sorted by total SDPI with ranking for each category (out of 9 teams) in parentheses.

2011 marked the first time since 2005 that Troy did not win at least a share of the Sun Belt championship. The Trojans lost six conference games in 2012, exceeding the number they lost from 2006-2010 (five losses). In their stead, Arkansas State won their second Sun Belt title and first outright conference title since winning the Southland and finishing undefeated in 1975. Rising up and joining the Red Wolves near the top of the league standings were the Hilltoppers from Western Kentucky. The IA neophytes finished 7-1 in Sun Belt play after winning just two conference games in their first two years in the league.

So Who Was Better Than Their Record Showed?
Louisiana-Monroe has finished with an above-average SDPI rating in each of the past three seasons. However, their conference record over those three seasons is just 12-12. Statistically, 2011 was the Warhawks best season. However, they were 0-3 in one-score games within the conference. Couple that with a non-league schedule that included trips to Florida State, TCU, and Iowa and you have the makings of a 4-8 disappointment.

So Who Was Worse Than Their Record Showed?
Western Kentucky was a solid Sun Belt team in 2011, but their statistical makeup was not that of a team with a robust 7-1 league record. The Hilltoppers were a little lucky in one-score games, posting a 3-1 mark in conference play. No Sun Belt team drastically exceeded their statistical peripherals in 2011.

Conference Superlatives:

Best Offense: Arkansas State 1.18
Hugh Freeze became Arkansas State's offensive coordinator in 2010 and he raised their offense from dead last in the Sun Belt to third. As the head coach in 2011, the offense continued to improve and ranked first in the league.

Worst Offense: -2.10
The Owls sent Howard Schnellenberger out with a winless conference season. The Owls were held below 300 yards five times in their eight league games.

Best Defense: Arkansas State 1.24
To complement their ferocious offense, the Red Wolves also boasted the league's best defense. No Sun Belt team gained more than 373 yards against them.

Worst Defense: Troy -1.82
The offense was below average in 2011, but the defensive ineptitude was the primary reason Troy plummeted in the conference standings. Four Sun Belt teams gained over 500 yards against the Trojans, and two others came very close (Arkansas State and Western Kentucky gained 489 and 494 yards respectively).

Rainey Day Players
Western Kentucky enjoyed by far their most successful season in 2011 since joining the Sun Belt as a full-time member in 2009. While the Hilltoppers rise in the standings was a total team effort, I wanted to recognize the play of their underrated star running back Bobby Rainey. Rainey did not play much as a redshirt freshman in 2008 when the Hilltoppers were provisional Sun Belt members. However, he earned the starting job early in his sophomore season and maintained a vice grip on it until his eligibility expired. The table below lists Rainey's rushing performance against Sun Belt teams for the past three seasons.
Rainey rushed for over 3100 yards since 2009 in conference play only! The Hilltoppers have played 24 league games since 2009, so his per game average is a very robust 131 yards per game. He topped the 100-yard plateau 16 times in 24 games, including 13 times in the past two seasons! He had some especially huge games in 2011, gaining 200 yards on the ground three times in league play! While Rainey was not an especially valuable receiver out of the backfield, he improved his catches and yardage each season. Here are his Sun Belt only receiving numbers since 2009.

Rainey also threw a touchdown against Arkansas State this season, meaning he accounted for 31 touchdowns versus Sun Belt foes since 2009 (26 rushing, four receiving, and one passing). As a team, the Hilltoppers scored 77 total offensive touchdowns against Sun belt foes since 2009. Thus, Rainey has accounted for over 40% (40.26 to be exact) of his team's total offensive touchdowns since joining the Sun Belt! Rainey went undrafted in the recently completed 2012 NFL Draft and is currently on the Baltimore Ravens roster. While he faces relatively long odds at making a profound impact in professional football, his performance at Western Kentucky was one worthy of praise from the hill tops.

Saturday, May 12, 2012

2012 Mountain West SDPI

This week we give the preeminent mid-major conference the SDPI treatment. The Mountain West has only been in existence since 1999, but already it has promoted two schools (TCU and Utah) to the 'big leagues' with a third (Boise State) to follow after the 2012 season is complete. For 2012, the conference will add three additional teams to replace the departing Horned Frogs (Fresno State, Hawaii, and Nevada). All three are consistent bowl teams, but will have their work cut out for them to unseat Boise State at the top. To see last year's post on the Mountain West, click here.

This first paragraph will explain how SDPI is calculated. So if you want the meat of this article skip on down. In the 2011 Mountain West regular season, conference play only, the average Mountain West team gained and allowed 2692.375 yards. The standard deviation for yards gained (offense) was 624.30 yards. The standard deviation for yards allowed (defense) was 342.69 yards. Air Force gained 3002 yards and allowed 2531 yards. Their offensive SDPI was 0.50 = [(3002-2692.375)/624.30]. Their defensive SDPI was 0.47 = [(2692.375-2531)/342.69]. Their total SDPI was 0.97. This number ranked 3rd in the Mountain West.

Here are the 2011 Mountain West standings.

Now here are the 2011 Mountain West SDPI standings. The standings are sorted by total SDPI with ranking for each category (out of 8 teams) in parentheses.

TCU defeated Boise State by a single point in mid-November to decide the Mountain West championship. The win likely cost the Broncos a shot at the national championship. Perhaps not surprisingly, TCU and Boise rated as the best teams in terms of SDPI in the Mountain West by a significant margin. They were also extremely close, with the Broncos edging the Horned Frogs by just .03 standard deviations. If this blog were CNN, the race between those teams would be too close to call. In the aforementioned TCU/Boise clash, the Horned Frogs inflicted just the third defeat on a Boise State team quarterbacked by Kellen Moore, one of the best college players of recent memory. In fact, the Horned Frogs can take great pride in beating Moore twice. Perhaps the most amazing fact about Moore's career is that his three total losses came by a combined five points. His Broncos lost to the Horned Frogs twice (by a point each time) and to Nevada in 2010 in overtime by three points. While Moore was quarterback of the Broncos, no team outscored them by more than a single point in regulation. Genuflect dear readers on true greatness!

So Who Was Better Than Their Record Showed?
Air Force pounded the dregs of the conference, beating Colorado State, New Mexico, and UNLV by a combined 94 points. Unfortunately, the Falcons could not break through and beat any of the league's stronger teams, losing to Boise State, TCU, and San Diego State by a combined 41 points (not a terrible margin considering the competition). The Falcons also failed to beat Wyoming, falling at home by eight points. The Falcons had the misfortune of playing extremely well against teams they were much better than and playing not as well against teams they were either on equal footing with or moderately worse than. Consequently, they ended up with a losing conference record despite solid peripherals.

So Who Was Worse Than Their Record Showed?
The Wyoming Cowboys did one thing extremely well in 2011. Unfortunately, the thing they did well is more a result of random chance than anything within their control. The Cowboys managed a flawless 5-0 record in one-score games in 2011 (3-0 within the conference). I suppose I was a bit premature in declaring the Cowboys only did one thing well. They also forced a ton of turnovers, leading the conference with 19 forced in their seven league games. This proclivity at forcing turnovers led to a league-leading +10 turnover margin in conference play and helped propel the Cowboys to five wins in the conference.

Conference Superlatives:

Best Offense: Boise State 1.37
The Broncos started conference play with a bang, rolling up 742 yards against Colorado State. They never returned to that lofty stratosphere, but they did manage to gain at least 416 yards in every remaining conference game.

Worst Offense: New Mexico -1.58
The good news for the Lobos is that they didn't finish ninth in the Mountain West like they did in 2010. The bad news is there were only eight teams in the Mountain West in 2011.

Best Defense: TCU 1.53
After being torched by the future Hesiman winner in the season opener, the Horned Frogs rebounded to post the best defense in the Mountain West for the fourth year in a row.

Worst Defense: Colorado State -1.22
To be fair, outside of their evisceration at the hands of Boise State (allowed 742 yards), the Rams were relatively average on defense. They allowed 395 yards per game in their other six conference games. If they had posted an average defensive performance against the Broncos, they would have finished a respectable fifth on defense in the Mountain West.

24 and Counting
The TCU Horned Frogs play their first ever Big 12 game on September 15th at Kansas. They will enter that contest with a rather impressive 24-game conference winning streak. The last time TCU lost a conference game was November 6, 2008 at Utah. The Horned Frogs lost that game 13-10, and the Utes wound up finishing the year unbeaten and ranked number two in the AP Poll. Had the Horned Frogs won that game, they would currently be riding a 33-game conference winning streak. Unfortunately, that game happened and the Horned Frogs have to be content with 24 in a row. How impressive is this in regards to recent history? To answer that question I looked at every conference win streak since the beginning of the BCS era (1998). There have been six instances (in addition to TCU's current active streak) of teams winning at least 20 conference games in a row since 1998. They are in chronological order: Florida State 24 games (1998-2001), Miami 27 games (1999-2003), Boise State 31 games (2001-2005), Southern Cal 27 games (2003-2006), Ohio State 20 games (2005-2007), and Boise State 22 games (2008-2010). To determine the relative 'impressiveness' of each streak, I calculated each team's average points scored and allowed in the streak, the number of close games they played (those decided by eight points or less), and the number of above-average teams they beat in the streak. I defined above-average as having an SRS score of greater than 0. The SRS, or Simple Rating System is a quick and dirty rating method utilized by College Football Reference that takes into account margin of victory and strength of schedule. The table below lists the merits of the seven streaks of at least 20 wins and also includes the team that ended the streak.
As the table makes clear, while Boise (first edition) does own the longest streak at 31 games, only about a quarter of their wins came against teams that would be classified as above-average. Continuing on the schedule angle, while Southern Cal has the smallest scoring margin of the seven teams and played in the most close games during the streak, they also faced an amazing 22 above-average opponents in their 27 games. Finally, Ohio State has the distinction of being the only one of these 'Magnificent Seven' to have their conference win streak ended on their home field. Compared to the other teams on this list, TCU appears to be a notch below the BCS conference schools, but based on point differential and schedule strength, is probably the most impressive of the mid-majors.

Sunday, May 06, 2012

2012 Conference USA SDPI

After giving all six BCS conferences the SDPI treatment, we not turn our attention to the little guys. We'll begin with Conference USA, a league that nearly sent a team to a BCS bowl for the first time ever. To see last year's SDPI post on Conference USA, click here.

This first paragraph will explain how SDPI is calculated. So if you want the meat of this article skip on down. In the 2011 CUSA regular season, conference play only, championship game excluded, the average CUSA team gained and allowed 3241.25 yards. The standard deviation for yards gained (offense) was 746.63 yards. The standard deviation for yards allowed (defense) was 441.29 yards. Rice gained 2926 yards and allowed 3467 yards. Their offensive SDPI was -0.42 = [(2926-3241.25)/746.63]. Their defensive SDPI was -0.51 = [(3241.25-3467)/441.29]. Their total SDPI was -0.93. This number ranked 9th in Conference USA.

Here are the 2011 CUSA standings.

Now here are the 2011 CUSA SDPI standings. The standings are sorted by division by total SDPI with ranking for each category (out of 12 teams) in parentheses.

Houston boasted the first undefeated regular season in Conference USA since Tulane in 1998. Unfortunately for the Cougars, things went horribly awry in the Conference USA Championship Game (on their home field no less!). While the conference missed out on having their first ever BCS bowl game participant, the league did finish with two teams ranked in the top 25 (Southern Miss and Houston) for the second straight year after going five seasons without a single league member finishing the season ranked in the top 25. Perhaps the most ringing endorsement of the league in 2011 was that the head coaches of both championship game participants got jobs in BCS conferences (Texas A&M and North Carolina).

So Who Was Better Than Their Record Showed?
The Knights from Central Florida followed up the best season in school history with a subpar 5-7 record. However, six of their seven losses game came by a touchdown or less, including a two-point loss at eventual champ Southern Miss. The Knights have been one of the premiere programs in the league since joining in 2005, so I don't think George O'Leary should start updating his resume just yet.

So Who Was Worse Than Their Record Showed?
The preeminent MAC program of the late-90's and early 2000's struggled upon entering Conference USA. 2011 marked the first season Marshall finished with a winning conference record since joining the league in 2005. Unfortunately, the (immediate) results may not be sustainable. Marshall was a perfect 5-0 in one-score games. While that in and of itself does not damn the Thundering Herd, it should also be noted that despite posting a winning record on the year, Marshall was actually outgained by 88 points over 13 games. A market correction of sorts is likely in store for 2012.

Conference Superlatives:

Best Offense: Houston 2.38
The Cougars gained at least 500 yards in each conference game, topped 600 yards five times, and 700 yards twice. Then in the biggest game of the season, they gained only 428 yards as they were upset by Southern Miss.

Worst Offense: Memphis -1.74
This marks two seasons in a row the Tigers have featured the worst offense in the conference. The Tigers were held below 200 yards in three of their eight conference games.

Best Defense: Southern Miss 1.48
Southern Miss was rarely dominant defensively (held only one conference opponent below 200 yards), but were consistently strong (just two conference opponents gained over 400 yards).

Worst Defense: UAB -1.63
Five of their eights conference opponent topped 500 yards against the Blazers. Six of their eights opponents also scored 30 or more on the Blazers moribund defense.

Balance of Power
Since Conference USA adopted a divisional format in 2005, its fair to say a balance of power has been established. Central Florida, East Carolina, or Southern Miss have won the East division each season. Meanwhile, in the West, Houston, SMU, or Tulsa has claimed each division title. Between those six teams, they have posted a winning record in the conference 29 times since 2005. The other six teams, Marshall, Memphis, and UAB in the East, and Rice, Tulane, and UTEP in the West, have posted six combined winning conference records between them in that same span. In fact, those six teams have had just one winning conference record in the past three seasons (Marshall's 5-3 mark in 2011). The top three teams in each division also rarely lose to those in the bottom three. The table below lists the combined records of the East Power Three (Central Florida, East Carolina, and Southern Miss) versus the East Bottom Three (Marshall, Memphis, and UAB) and the West Power Three (Houston, SMU, and Tulsa) versus the West Bottom Three (Rice, Tulane, and UTEP).
The East and West Power Three have both posted sterling marks against the East and West Bottom Three. Both sets of power triumvirates have won more than 70% of their games against the bottom teams. SMU has fared the worst among both sets of power trios by going just 11-10 against the dregs of the West. However, it should be noted that the Mustangs went winless in conference play for two consecutive seasons (2007 and 2008). In the other five seasons, they have gone a robust 11-4 versus Rice, Tulane, and UTEP. Regression by Marshall and improvement by Central Florida and East Carolina should maintain that balance of power in the East. Meanwhile, in the West, SMU and Tulsa should be the dominant teams, resigning Rice, Tulane, and UTEP to second-division status once again.

Sunday, April 29, 2012

2012 SEC SDPI

In our final BCS conference SDPI examination of the 2011 college football season, we come to the SEC, home of the last six national champions, and the home to both participants in the 2011 BCS National Championship Game. To see last year's post on the SEC, click here.

This first paragraph will explain how SDPI is calculated. So if you want the meat of this article skip on down. In the 2011 SEC regular season, conference play only, championship game excluded, the average SEC team gained and allowed 2612.33 yards. The standard deviation for yards gained (offense) was 511.33 yards. The standard deviation for yards allowed (defense) was 633.43 yards. Arkansas gained 3217 yards and allowed 2912 yards. Their offensive SDPI was 1.18 = [(3217-2612.33)/511.33]. Their defensive SDPI was -0.47 = [(2612.33-2912)/633.43]. Their total SDPI was 0.71. This number ranked 5th in the SEC.

Here are the 2011 SEC standings.

Now here are the 2011 SEC SDPI standings. The standings are sorted by division by total SDPI with ranking for each category (out of 12 teams) in parentheses.

Statistically, Alabama was head and shoulders above the rest of the league. Unfortunately, their kicking errors and lack of success in the red zone allowed LSU to win the SEC championship. Fortunately for them, enough upsets occurred elsewhere in college football to allow them a rematch with the Tigers in the BCS National Championship Game. And the rest, as they say, is history.

So Who Was Better Than Their Record Showed?
Vanderbilt qualified for a bowl game in James Franklin's first season as head coach, but their 2-6 SEC record was not indicative of their play. The Commodores were a hard-luck 0-4 in one-score games, losing close contests in Nashville to Georgia and Arkansas and on the road to Florida and Tennessee. Vanderbilt was also exceptionally dominant in their two league wins, beating Ole Miss and Kentucky by a combined 53 points.

So Who Was Worse Than Their Record Showed?
The easy answer here is LSU as the Tigers did not have the statistical profile of an unbeaten team. However, the correct answer is the other Tigers from Auburn. Auburn's four SEC wins came by a combined 39 points. Their four SEC losses came by a combined 125 points. Team's that post Auburn's statistical profile typically win about two of eight conference games. All things being equal, they should have switched records with Vanderbilt in 2011.

Conference Superlatives:

Best Offense: Alabama 1.37
Even when they posted back-to-back 8-0 SEC records in 2008 and 2009, the Crimson Tide only finished fifth in offense in the conference. The 2011 offense was incredibly consistent, gaining between 366 and 437 yards six times in their eight league games.

Worst Offense: Kentucky -1.49
After losing quarterback Mike Hartline and receiver Randall Cobb from the third ranked SEC offense in 2010, the Wildcats plummeted to the worst offense in the conference. The Wildcats were held to ten or fewer points in six of their eight league games!

Best Defense: Alabama 1.84
The Tide were uber-dominant on this side of the ball. Five of their eight SEC opponents were held below 200 yards and no team gained more than 239 yards against them!

Worst Defense: Ole Miss -1.40
Facing the top-four offenses in the conference (Alabama, Georgia, Arkansas, and LSU) didn't help their numbers, but the Rebels were bad anyway you slice it. Remember, they gave up 30 points to the worst SEC offense (Kentucky).

John L Smith: The 'L' is for Loser
As you may have heard, the Arkansas Razorbacks have experienced a change in their head coaching position. I won't dwell on the circumstances surrounding the ouster of Bobby Petrino, but a cursory Google search should lead you to the story if you've been out of the loop. However, I will focus on his replacement, one John L Smith. Arkansas marks Smith's sixth destination as a head coach. Smith previously coached at Idaho (when they were IAA), Utah State, Louisville, Michigan State, and Weber State (more on that later). I am of the opinion that Arkansas could not have done much worse in their search for a replacement for Mr. Petrino. I will let you know up front, what follows is a hugely biased hatchet job, not unlike the Fox News special report on gas prices that aired a few weeks ago. However, unlike Fox News, I admit my biases. Why do I have such disdain for Mr. Smith? Primarily because I feel that much like Greg Norman at a golf tournament, John L Smith finds a way to lose. I believe that his teams constantly underachieved relative to their talent level. How can one go about determining whether or not a team under or overperformed? One way is to look at a team's Pythagorean Record. A team's Pythagorean Record is their predicted record based on the ratio of the points they scored to the points they allowed. First developed by Bill James for use in baseball, a team's Pythagorean Record can give us a pretty good approximation of a team's record. With that in mind, I looked at the IA teams coached by John L Smith in the 12 seasons from 1995-2006. I took each of his team's record against IA foes and compared it to their expected record based on the Pythagorean Theorem. For fun, I also calculated each team's record in one-score games. The table below summarizes the results.

In 12 seasons, Smith's teams finished a little more than six games worse than where we would have expected them to finish based on their points scored and allowed. Is this a huge difference? I don't know. To answer this question, we would need to calculate how other coaches have performed relative to their Pythagorean Record over an extended period of time. Perhaps one day I shall embark on that brave undertaking. For now though, we can say that his teams underperformed their Pythagorean Record over 12 seasons and 137 games (a relatively large sample). His teams drastically underperformed during his four seasons in East Lansing, finishing over four games below where they would have been expected to finish based on their scoring ratios. In addition, over a relatively healthy sample size of 50 games, his teams won just 40% of their one-score contests (20-30 record).

In addition to the Pythagorean numbers, I also examined the results for each game Mr. Smith coached over those 12 seasons to see if I could find any head-scratching results. I found a few. In 1995, his Utah State Aggies lost to Boise State when the Broncos were still a IAA team. In 1997, his bowl bound Utah State Aggies lost to a North Texas team that finished 4-7. His second Louisville team lost to a 3-9 Army squad 52-59. Army scored just 225 points that whole season and were shut out twice. His first Michigan State team lost at home to a 5-7 Louisiana Tech squad in 2003. His 2004 team missed out on a bowl because they lost the season opener to Rutgers. Rutgers finished 4-7 that season and lost the very next week to IAA New Hampshire. That same Spartan team also provided one of the few bright spots in Tyrone Willingham's final season as coach of Notre Dame as the Irish beat Michigan State in east Lansing en route to a 6-6 record. Michigan State also lost to Penn State in 2004. As you may not remember, that Penn State team went just 4-7 and prior to their 37 point outburst against the Spartans, the Nittany Lions had averaged just a shade over 9 points per game in their first seven Big 10 games. 2005 featured this historic meltdown that can't be put into words.

Finally, in his Michigan State swan song, his charges blew a huge lead at home against Notre Dame and also lost by 25 points to an Indiana team that finished 5-7.Of course, I'll admit, if you look hard enough, you can find some fantastic performance from his teams, like the greatest comeback in college football history. On the other hand, what are you doing trailing Northwestern by 35 points in the first place?

 Finally, while I obviously don't know Smith personally, his dealings with his employers have been less than forthright. He allegedly accepted the Michigan State job at halftime of Louisville's 2002 bowl game. He also left Weber State hanging by accepting the Arkansas job before coaching a game for the Wildcats.We'll see how Smith does with the great talent on hand at Arkansas, but consider me extremely skeptical of this coaching hire.

Sunday, April 22, 2012

2011 Pac-12 SDPI

This week in our SDPI journey, we attempt to shed our east-coast bias and examine the Pac-12. To see last year's post on what was then known as the Pac-10, click here.

This first paragraph will explain how SDPI is calculated. So if you want the meat of this article skip on down. In the 2011 Pac-12 regular season, conference play only, championship game excluded, the average Pac-12 team gained and allowed 3707.75 yards. The standard deviation for yards gained (offense) was 569.97 yards. The standard deviation for yards allowed (defense) was 392.36 yards. Cal gained 3656 yards and allowed 3225 yards. Their offensive SDPI was -0.09 = [(3656-3707.75)/569.97]. Their defensive SDPI was 1.23 = [(3707.75-3225)/392.36]. Their total SDPI was 1.14. This number ranked 3rd in the Pac-12.

Here are the 2011 Pac-12 standings.

Now here are the 2011 Pac-12 SDPI standings. The standings are sorted by division by total SDPI with ranking for each category (out of 12 teams) in parentheses.
In 2011, the Pac-12 was a top heavy league, both in national reputation and actual performance. Three teams (Oregon, Stanford, and Southern Cal) finished the season ranked in the top-10, but no other team was ranked in the top-25. Similarly, four teams (Stanford, Oregon, Southern Cal, and Cal) finished with SDPI ratings over 1.00. However, none of the other eight teams finished with a positive SDPI rating. The two newcomers to the conference suffered the indignity of finishing eleventh and twelfth in the conference in SDPI.

So Who Was Better Than Their Record Showed?
The California Golden Bears finished with a losing conference record despite boasting one of the strongest defenses in the conference. Why did the Bears have a relatively grisly record, at least compared to their statistical profile? One reason is schedule strength. The Bears were unfortunate to reside in the same division as the top-two teams in the conference, Stanford and Oregon. The Bears also had to face the third best team (Southern Cal) in one of their games against the Pac-12 South. Another reason related to schedule strength is their road schedule. The Pac-12 plays a nine-game conference schedule (it has played one since 2006) and thus every other year each team must face five road games while playing just four at home. The Bears had five league road games in 2011 and went just 1-4 in those games, while going 3-1 at home. The third and final reason has to do with one-score games. The Bears played in just two one-score games in 2011, losing both. Those three facts coupled with the small sample of size of a nine-game season conspired to make Cal, a team that could very well have gone 6-3 or 7-2 in the Pac-12, to go a somewhat disappointing 4-5.

So Who Was Worse Than Their Record Showed?
The UCLA Bruins didn't do anything particularly well in 2011, yet thanks to some close game luck and some prior indiscretions at Southern Cal, they won the Pac-12 South. Over the course of their nine conference games, UCLA was outscored by 69 points. However, in one-score games they managed a perfect 3-0 record and earned the honor...of becoming a 6-8 bowl team?

Conference Superlatives:

Best Offense: Oregon 1.40
This is becoming old hat for Chip Kelly. The Ducks have posted the best offense in the conference each season he has been either offensive coordinator or head coach (2007-present).

Worst Offense: Utah -1.80
It was not a banner season for the Utes in their first trek through a BCS conference. The Utes were held below 400 yards in each of their nine conference games, topping out at 358 yards against Washington State.

Best Defense: Stanford 1.56
The Cardinal were very consistent on the year, holding seven of nine league opponents (including Oregon) under 400 yards.

Worst Defense: Colorado -1.81
The Buffaloes put things together in their final game, holding Utah (the league's worst offense) to 274 yards. That was about 244 yards less than they allowed to conference foes going into that game.

Where's The Middle?
Since 2008, only four Pac-10/12 teams have finished the season ranked in the AP top-25. Among the six BCS conferences, that is second to last, ahead of only the Big East (which has had two and four fewer teams than the Pac-10/12 in that span).
The mighty SEC reigns supreme in this category, boasting 19 top-25 teams in that span, with the Big 12, Big 10, and ACC lagging behind, but still far ahead of the Pac-10/12 and the Big East. However, when we look at teams that have finished the season ranked in the AP top-10, the Pac-10/12 has fared much better.
Their seven top-10 teams rank third behind the SEC with an incomparable 11 and the Big 10 with eight. Framed another way, 70% of the Pac-10/12 teams that have finished the season ranked in the AP top-25 since 2008 have finished in the top-10. That is by far the highest percentage of any of the six BCS conferences.
2011 was a perfect microcosm for how the Pac-10/12 has played out the past four season. The conference finished with three teams ranked in the top-10 (Oregon, Southern Cal, and Stanford), but no other teams ranked in the top-25. Since 2008, the Pac-10/12 has been dominated by those three teams, but has had a dearth of mid-level teams. In my opinion, this has harmed the league's credibility on a national scale, as many casual observers discount the accomplishments of the Big 3 because they see no other Pac-10/12 schools ranked in the top-25. Dear reader, don't fall prey to this east coast elitist bias. Oregon, Southern Cal, and Stanford have each produced several elite seasons in the past four years and deserve, nay demand your genuflection.

Saturday, April 14, 2012

2011 Big 12 SDPI

We're already halfway through the BCS conferences on our SDPI-guided journey through the 2011 college football season. We'll turn the corner after this week's edition where we examine the Big 12. To see last year's post on the Big 12, click here.

This first paragraph will explain how SDPI is calculated. So if you want the meat of this article skip on down. In the 2011 Big 12 regular season, conference play only, the average Big 12 team gained and allowed 4008.3 yards. The standard deviation for yards gained (offense) was 808.47 yards. The standard deviation for yards allowed (defense) was 518.18 yards. Iowa State gained 3572 yards and allowed 4095 yards. Their offensive SDPI was -0.54 = [(3572-4008.3)/808.47]. Their defensive SDPI was -0.17 = [(4008.3-4095)/518.18]. Their total SDPI was -0.71. This number ranked 7th in the Big 12.

Here are the 2011 Big 12 standings.Now here are the 2011 Big 12 SDPI standings. The standings are sorted by total SDPI with ranking for each category (out of 10 teams) in parentheses.The 2011 season marked the first season of Big 12 play sans divisions as Colorado and Nebraska departed for the Pac-12 and Big 10 respectively. 2011 also marked the first time since 2003 that a team other than Oklahoma or Texas won the Big 12 title. The conference title was Oklahoma State's first since 1976, and their first outright conference title since 1948 when they were in the Missouri Valley! Elsewhere in the standings, Kansas became the first Big 12 team to go winless in the conference since Iowa State in 2008.

So Who Was Better Than Their Record Showed?
Despite very solid peripherals (top-four on both sides of the ball), Texas A&M endured a losing season in the conference and got their coach fired. The Aggies were 1-4 in one-score games in the conference, with their lone non-competitive loss coming at Oklahoma. Perhaps most disheartening for the Aggies was that they had double-digit leads in each of those close conference losses. They led Oklahoma State by 17 points at halftime, Missouri by 14 in the second quarter, Kansas State by 14 in the second quarter, and Texas by 13 in the second quarter. The Aggies should see their luck change a little in 2012, but unfortunately for them, they will be plying their trade in the take-no-prisoners SEC West. Good luck with that.

So Who Was Worse Than Their Record Showed?
Kansas State had their best conference finish since winning the Big 12 in 2003. However, six of their seven wins came by seven points or fewer. In fact, despite winning nine of their seven conference games, the Wildcats outscored their league opponents by just nine total points. Not only did they have exceptional luck in close games, the Wildcats also finished with a +13 turnover margin in league play (second best). The Wildcats are a unanimous choice by statistical indicators to regress in 2012.

Conference Superlatives:

Best Offense: Baylor 1.32
Led by a Heisman-winning quarterback who looked a little like Terence Trent D'Arby, the Bears ran roughshod over Big 12 defenses. They gained over 600 yards in five of their nine league games and were never held below 429 yards. With Robert Griffin and Kendall Wright both heading to the NFL, the Bears better find a wishing well if they want to recreate their success in 2012.

Worst Offense: Kansas -1.77
How do you say something nice about something this terrible? Here goes: In their final four conference games, the Jayhawks allowed over 500 yards just once after allowing that many four times in their first five games.

Best Defense: Texas 1.93
The Texas defense is a shade overrated thanks to their performance against Kansas when they allowed just 46 yards to the Jayhawks! Take away that awesome showing and credit the Jayhawks with an average performance and Texas still boasts the best defense in the conference, albeit one that is not otherworldly.

Worst Defense: Baylor -1.22
The Bears needed each and every yard and point their magnificent offense gained thanks to a defense that was in hibernation.

Upgrade?
As most college football observers know, the Big 12 will have lost two (more) league members when the football season begins in the fall. Missouri and Texas A&M are on their way to the SEC. In their place, the league has added a mid-major power in TCU and the dominant Big East program of the last half-decade in West Virgina. How do these two newcomers compare to the two programs that headed east? To find out, I looked at the SRS ratings of the four schools for the past five seasons (2007-2011). The SRS rating is a quick and dirty rating system utilized by college football reference dot com. It estimates how many points a team is better than average. The table below lists the four teams and their respective SRS ratings from 2007-2011 with their SRS national rankings in parentheses and a weighted average national ranking (with most recent seasons counting more heavily). As you can see, based on weighted national ranking, the Big 12 appears to be getting a minor upgrade. However, based on the way Texas A&M is trending and the relative stagnation of the West Virginia program, I would call the new additions a wash.

Sunday, April 08, 2012

2011 Big 10 SDPI

In our SDPI jaunt through college football, we now head to the midwest. Home of dairy, corn, and some pretty good football in 2011. To check out last year's post on the Big 10, click here.

This first paragraph will explain how SDPI is calculated. So if you want the meat of this article skip on down. In the 2011 Big 10 regular season, conference play only, championship game excluded, the average Big 10 team gained and allowed 2904.167 yards. The standard deviation for yards gained (offense) was 410.08 yards. The standard deviation for yards allowed (defense) was 502.52 yards. Penn State gained 2759 yards and allowed 2615 yards. Their offensive SDPI was -0.35 = [(2759-2904.167)/410.08]. Their defensive SDPI was 0.58 = [(2904.167-2615)/502.52]. Their total SDPI was 0.22. This number ranked 7th in the Big 10.

Here are the 2011 Big 10 standings.Now here are the 2011 Big 10 SDPI standings. The standings are sorted by division by total SDPI with ranking for each category (out of 12 teams) in parentheses.The Big 10 began divisional play in 2011 and thanks to a late roughing the punter penalty, the best team in the conference (Wisconsin) survived and advanced to the Rose Bowl. The second best team by SDPI (Michigan) received an at-large BCS bid to the Sugar Bowl. All told, the Big 10 boasted ten bowl teams, with only Indiana and Minnesota missing out on the postseason. The new format did produce some interesting results. Indiana became the first Big 10 team to go winless in conference play since Minnesota in 2007 (also under a first year coach), while Wisconsin became the first Big 10 champion to lose more than one conference game since the Purdue/Michigan/Northwestern logjam in 2000!

So Who Was Better Than Their Record Showed?
Outside of Wisconsin, SDPI viewed Illinois as the class of the Leaders Division, ranking them fourth overall. Alas, the Illini committed a league-high 21 turnovers in their eight conference games en route to a league worst turnover margin of -10. Their offense not only turned the ball over frequently, they also had trouble scoring points. In their final six conference games (all losses), the Illini were held to seven points three times, and never managed to top 17 points in any game. On a related note, the Illini changed coaches this offseason.

So Who Was Worse Than Their Record Showed?
Penn State stayed in contention for the Leaders Division crown until the last weekend of the regular season despite an offense that appeared to be using the playbook of Walter Camp. The Nittany Lions were the anti-Illini. Neither team could score, and both played solid to good defense. However, the Nittany Lions did a better job of holding onto the football (15 turnovers in Big 10 play) and forcing turnovers (17 in Big 10 play). They also fared well in one-score games, going 4-1 in such conference contests. As you may have heard, the Nittany Lions will have a new coach in 2012, and he doesn't step into a great situation.

Conference Superlatives:

Best Offense: Wisconsin 1.69
Russell Wilson fit like a glove, giving the always vaunted running attack a complimentary piece throwing the ball. Don't let the conference records fool you, the 2011 team (6-2) was better than the 2010 team (7-1) on both sides of the ball.

Worst Offense: Minnesota -1.44
The Gophers were held below 300 yards of offense in half their conference games. However, the running game did show signs of life late in the season, as the Gophers channeled a little Glen Mason in averaging 259 yards on the ground against Northwestern and Illinois in their final two games.

Best Defense: Illinois and Wisconsin 1.10
The Illini and Badgers allowed the exact same number of yards to Big 10 foes. The Badgers pulled double duty, possessing both the league's top offense and defense. However, while their offense was one of the best the Big 10 has seen in years, their defense was the worst to rank number in the conference in the seven years (2005-2011) I have been tracking SDPI. That relatively pedestrian defense was torn asunder in the Rose Bowl by Oregon, allowing 621 yards and 45 points to the Ducks.

Worst Defense: Indiana -2.10
The Hoosiers allowed every conference foe to top at least 400 yards against them and allowed at least 30 points in seven of eight conference games.

A Bad Time to be Good
Michigan State has gone a collective 14-2 against the Big 10 the past two seasons, yet has as many BCS bowl appearances in those two seasons as Indiana who is 1-15 that span. Like Salieri in the film Amadeus, the Spartans have been very good, but their rise has not been timely. In 2010, they finished in a three-way tie for first with Wisconsin and Ohio State, but were denied a BCS berth. In 2011, the Spartans won the Legends Division, but lost a close game in the inaugural Big 10 Championship Game to Wisconsin and were denied an at-large BCS berth. To make matters worse, the Spartans are actually 3-1 against Big 10 BCS bowl teams over the past two seasons, beating Wisconsin in 2010, Michigan in 2011, and splitting with Wisconsin in 2011. I wanted to see how hard luck the Spartans had been, so I looked at the six BCS conferences since 1998 (the first year of the BCS) to see if any teams had similar gaudy records and no BCS bowl games to show for it. The Spartans are in rare company. Kansas State had by far the most glossy two-year record to never be invited to a BCS bowl. The Wildcats finished the 1998 regular season unbeaten in the Big 12 and overall, but lost the Big 12 Championship Game in overtime and were relegated to the Alamo Bowl. In 1999, they lost only to eventual Big 12 champion Nebraska, and settled for the Holiday Bowl. Only one other team finished with a conference record equal to Michigan State's over a two-year period. Texas went 7-1 in the Big 12 in 2000, but their one loss was to the undefeated and eventual national champion Oklahoma Sooners. An additional regular season loss to Stanford consigned them to the Holiday Bowl. Texas finished the 2001 season 7-1 in the Big 12 and were heavy favorites over Colorado in the Big 12 Championship Game. They were upset and again settled for the Holiday Bowl. Only two other teams have been as unfortunate as the Spartans when it comes to winning a lot of games over a two-year period and being shut out of a BCS bowl. It should also be noted that those two teams played in an era prior to 2006 when there were only four BCS bowls instead of five and thus two fewer slots.

Sunday, April 01, 2012

2011 Big East SDPI

In the second installment of our SDPI sojourns, we take a look at the Big East, a conference that will be changing somewhat in 2012 (swapping out West Virginia for Temple) and then undergoing dramatic changes in 2013. For now though, we will focus on the present, or more accurately the recent past. To check out last year's SDPI post on the Big East, click here.

This first paragraph will explain how SDPI is calculated. So if you want the meat of this article skip on down. In the 2011 Big East regular season, conference play only, the average Big East team gained and allowed 2522.375 yards. The standard deviation for yards gained (offense) was 333.95 yards. The standard deviation for yards allowed (defense) was 189.47 yards. Cincinnati gained 2519 yards and allowed 2595 yards. Their offensive SDPI was -0.01 = [(2519-2522.375)/333.95]. Their defensive SDPI was -0.38 = [(2522.375-2595)/189.47]. Their total SDPI was -0.39. This number ranked 6th in the Big East.

Here are the 2011 Big East standings.Now here are the 2011 Big East SDPI standings. The standings are sorted by total SDPI with ranking for each category (out of 8 teams) in parentheses.In their final season as Big East members, West Virginia won a three-way tiebreaker with Cincinnati and Louisville to nab the conference's automatic bid to the Orange Bowl. In that game, the Mountaineers trounced ACC champion Clemson, moving the ball seemingly at will in accumulating 70 points. The game marked their first foray into a BCS game since Rich Rodriguez left for Michigan following the 2007 regular season. The Mountaineers have dominated the Big East since the league's current incarnation in surfaced in 2005, and their departure leaves this the most wide open BCS conference race in 2012.

So Who Was Better Than Their Record Showed?
South Florida finished tied with Syracuse in the basement of the Big East, winning just once in seven conference games. However, outside of a non-competitive game against Pitt (lost 44-17), the Bulls played well enough to win in their other five league losses. The Bulls lost three games by a field goal each against Cincinnati, Rutgers, and West Virginia. For good measure, they also lost by six to Connecticut. South Florida also posted the league's worst in-conference turnover margin at -6. None of these facts will change the way the 2011 season played out, but it does mean South Florida is likely due for marked improvement in 2012.

So Who Was Worse Than Their Record Showed?
Both teams that finished tied with West Virginia at the top of the league were very fortunate to do so. Cincinnati and Louisville both posted middling peripherals, ranking sixth and seventh respectively in overall SDPI. In fact, Louisville's defense was the only facet of either team that was better than the Big East average. Both teams did go a combined 5-2 in one-score games, aiding them in their pursuit of a championship.

Conference Superlatives:

Best Offense: West Virginia 1.54
Offensive coordinator turned head coach Dana Holgorsen did what he was paid to do. The Mountaineers topped 400 yards in five of their seven Big East games. For good measure, they moved the ball quite well against one of the nation's best defenses in the non-conference, amassing 533 yards against LSU.

Worst Offense: Connecticut -1.43
The Huskies never gained more than 329 yards in Big East play and were held below 300 yards four times.

Best Defense: Rutgers 1.71
One season after being the worst in the Big East, the Scarlet Knights improved dramatically. They held four of their seven Big East foes under 300 yards and only West Virginia was able to consistently move the ball against them (gaining 428 yards).

Worst Defense: Connecticut -1.58
The Huskies pulled double duty, pairing the worst offense in the league with the worst defense. Outside of a stalwart defensive showing against Louisville (allowed 299 yards), the Huskies showed little resistance. Yet somehow a team with the worst offense and defense in the conference managed to win three of seven games.

Welcome Back Temple
Following the 2004 season, the Big East kicked the Temple Owls out of the conference. After spending 14 seasons in the conference and never winning more than four games in any one of them, you could understand the league's logic. Temple spent two seasons as a IA nomad without a conference, winning just a single game (it was against Bowling Green) in those two seasons. However, the Owls made a good hire while they were an independent, tabbing Al Golden to be their coach. Golden took the reins in 2006 and went 1-11. The Owls joined the MAC in 2007, and their fortunes shifted. They won four games, then five in 2008, and then nine in 2009 (while also qualifying for their first bowl game in nearly 30 years). They were bowl eligible again with eight wins in 2010, but like Alanis Morissette, were uninvited to the postseason. Golden left for Miami after the 2010 season, but the Owls continued their run of success under his successor Steve Addazio, winning nine games, including just their second ever bowl game. And wouldn't you know it, their old girlfriend noticed. Having just been dumped by West Virgina and needing an eighth date to the box social, the Big East invited Temple back into the fold. The Owls have truly come full circle. From BCS conference laughing stock, to worst team in IA, to MAC power, back to a BCS conference, this time as a reasonable contender. How reasonable are the Owls as a contender? The table below lists Temple's SRS ratings (per college football reference) since 2007. The SRS is a quick and dirty way of rating teams based on who they played and how much they won or lost by. It basically measures a team as the number of points above or below average they are. In any given season, the very best teams in college football are usually +20. The table also lists their SRS national rank and where they would have ranked in the Big East. As you can see, while the Owls may have been a MAC power, they were below average when compared to the rest of IA from 2007-2010. Their 2011 season was solid, but still they would have ranked just fourth in the Big East. Temple is certainly a program on the rise, especially considering where they were just five seasons ago, but they may experience some growing pains in moving to a BCS conference, even one that lacks a true powerhouse team like the Big East.

Saturday, March 24, 2012

2011 ACC SDPI

I know a lot of regular readers were becoming worried that the offseason SDPI recaps had slowly gone the way of the buffalo. Fear not, SDPI returns! For those who don't know what SDPI is, here is the Reader's Digest synopsis. SDPI measures how many standard deviations a team is above or below average at gaining and preventing yards. Since conference play occurs in a vacuum, teams are rated against their conference mates and not against the nation at large. Since there are 11 conferences, you can look forward to 11 posts on how SDPI played out in 2011. We'll begin with the six BCS conferences and tackle those in alphabetical order before moving on to the mid-major leagues. As always, we begin with the ACC. Here's the link to last year's ACC post.

This first paragraph will explain how SDPI is calculated. So if you want the meat of this article skip on down. In the 2011 ACC regular season, conference play only, championship games excluded, the average ACC team gained and allowed 3043.75 yards. The standard deviation for yards gained (offense) was 309.47 yards. The standard deviation for yards allowed (defense) was 360.91 yards. NC State gained 2716 yards and allowed 2601 yards. Their offensive SDPI was -1.06 = [(2716-3043.75)/309.47]. Their defensive SDPI was 1.23 = [(3043.75-2601)/360.91]. Their total SDPI was 0.17. This number ranked 8th in the ACC.

Here are the 2011 ACC standings.Now here are the 2011 ACC SDPI standings. The standings are sorted by division by total SDPI with ranking for each category (out of 12 teams) in parentheses.Clemson and Virginia Tech ended up in a virtual tie atop the SDPI ratings, and lo and behold both teams represented their respective divisions in the ACC Championship Game. Clemson routed the Hokies in Charlotte, winning their first ACC title since 1991. Joining Clemson and Virginia Tech in the upper-tier of the ACC was Florida State. After the Seminoles, five teams (Georgia Tech, North Carolina, Miami, Virginia, and NC State) were within four tenths of a standard deviation of each other. Perhaps not surprisingly, those five teams finished a combined 20-20 in the ACC.

So Who Was Better Than Their Record Showed?
Florida State won four conference games by 20 points or more. That was the most of any team in the ACC. However, the Seminoles were not quite as fortunate in close games, losing one-score decisions to Clemson, Wake Forest, and Virginia leaving them with a somewhat deceiving 5-3 conference mark. A few lucky breaks here or there, and perhaps Florida State is playing in the Orange Bowl and not embarrassing the conference.

So Who Was Worse Than Their Record Showed?
Wake Forest used some Jim Grobe magic (patent pending) and nearly stole the division away from Clemson. Four of the Deacons five league wins came by eight points or fewer. Unfortunately, in the games that were not close, the Deacons ended up on the losing end. In two of their three conference losses, the Deacons were beaten by a combined 46 points by Virginia Tech and North Carolina.

Conference Superlatives:

Best Offense: Clemson 1.64
Here's what a high school offense can do. The Tigers topped 500 yards in three of their eight conference games after doing so just once from 2007-2010.

Worst Offense: Boston College -2.26
While Clemson rose (meteorically I might add) from the offensive abyss they occupied in 2010, Boston College dug deeper. The Eagles were held below 300 yards in five of their eight conference games and topped out with a 404 yard effort against Maryland.

Best Defense: Florida State 1.43
After opening conference play with consecutive defeats to Clemson and Wake Forest, during which they allowed a combined 834 yards (hardly a terrible amount), the Seminoles put the ACC on lockdown. Their last six league opponents averaged just 282 yards per game.

Worst Defense: Maryland -1.80
The Temple debacle was a chilling vision of things to come. The Terps, prohibitive favorites against the Owls, allowed 285 yards on the ground and were bludgeoned in their own stadium. In their ACC games. the Terps twice allowed opponents to rush for over 300 yards against them (Clemson and Boston College) and held just two conference opponents under 400 yards (Miami and Georgia Tech). Perhaps not coincidentally, the Terps beat Miami and suffered their closest ACC loss to Georgia Tech.

Florida State Football: Brought to You by Hype Williams
2011 began like many Florida State seasons before it, with the Seminoles ranked in the AP Top-10. Unfortunately, it ended like many Florida State seasons, with the Seminoles ranked outside the AP Top-10. In fact, since 2001 (the year after their last national championship game appearance), Florida State has begun the season in the top-10 and finished outside the top-10 four times, tied for the most nationally with Florida and Oklahoma.The Gators of course, can revel in their two national titles and the Sooners can take solace in their three national championship game appearances since 2001, Florida State has come nowhere near those heights. Florida State may not begin the 2012 season in the top-10, but if they are, this likely represents their best chance to live up to the hype.

Saturday, March 10, 2012

The Predictive Powers of Pythagoras

Regardless of what any talking head or former player may say on ESPN regarding intangibles and heart, team success is a function of the points they score and the points they allow. With that in mind, I want to take a fresh look at the Pythagorean Theorem and its predictive powers in college football. I've looked at the Pythagorean Theorem on this blog before. In fact, in my very first blog post nearly seven years ago (time flies), I accurately surmised that the 2005 Tennessee Vols were not national title contenders despite their top-5 preseason ranking. For those who don't know what the Pythagorean Theorem is (at least as to how it relates to sports), here's a snippet from that first post:

'In 1980 noted baseball analyst and the founder of sabermetrics, Bill James, developed a theory for predicting a team's winning percentage based on the number of runs a team scored and allowed. He called it the Pythagorean Theorem of baseball and it looked something like this:

(Runs Scored)^2
------------------------------------
(Runs Scored)^2 +(Runs Allowed)^2

The resulting ratio was a team's estimated winning percentage. Over the course of a 162 game season the Pythagorean Theorem predicted the final record for most teams within three or four games of their actual performance. The Pythagorean Theorem has application beyond baseball (and some triangles I hear). It could also be applied to predict a football team's actual performance.'

The other day I was brainstorming ways to make the Pythagorean Theorem more accurate. Football has a unique scoring system. Touchdowns are worth six points, field goals three, and safeties two. In addition, after touchdowns, teams can attempt to kick for one point or cross the goal again for two additional points. By contrast, in baseball and hockey, scoring events, runs and goals, are worth the same amount each time. Basketball is a little more complex, with free throws worth one point, field goals worth two points, and shots behind a certain arc worth three points. Basketball also has more scoring events than baseball and hockey. With that in mind, I wanted to look for a scoring event in football that is analogous to a run in baseball or a goal in hockey. Its actually pretty easy to find. Offensive touchdowns. Teams score offensive touchdowns at about the same ratio that teams score runs in baseball and goals in hockey. In addition, offensive touchdowns help us get rid of some of the statistical 'noise' generated during a football game. Field goals (both for and against) are heavily dependent on one individual player in a sport where team play matters most of all. Special teams and defensive touchdowns, while they play a huge role in the winner of an individual game, do not have a great deal of predictability going forward. Notice I said 'some' of the noise, but certainly not all. Defensive and special team ability can make offensive touchdowns easier by setting up the offense with a short field. Still, ignoring all scoring plays except for offensive touchdowns should give us a good idea about a team's strength.

So how does this relate to the Pythagorean Theorem? Well instead of looking at a teams ratio of points scored to points allowed, we'll look at a teams ratio of offensive touchdowns to offensive touchdowns allowed. The formula will look a little something like this:

(Offensive Touchdowns)^2.37
-----------------------------------------------------------------------
(Offensive Touchdowns)^2.37 +(Offensive Touchdowns Allowed)^2.37

We'll call the resulting record a team's Adjusted Pythagorean Record (or APR). I used 2.37 as the exponent because research has shown it makes the resulting ratio a more accurate predictor.

Now lets take a look at the Adjusted Pythagorean Theorem in action.

In 2007, Oklahoma State enjoyed a rather 
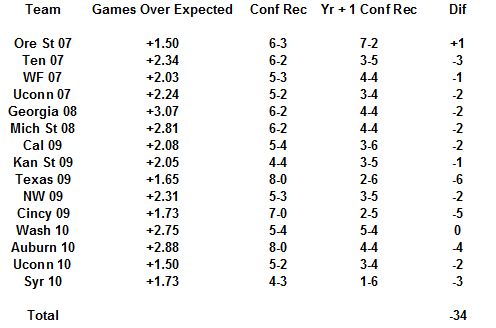
middling season in the Big 12. There were some highlights of course. They beat Nebraska in Lincoln for the first time since 1960, upended a Kansas State team ranked in the top-25 at the time, and gave Texas a run for their money in Stillwater. They were also trounced by Oklahoma and beaten by Kansas in Stillwater for the first time since 1995. All in all, the Cowboys went 4-4 in the Big 12. How did they do according to the Adjusted Pythagorean Theorem? Well, in their eight conference games, they scored 35 offensive touchdowns. Not bad. That tied for the third highest number in the conference. Unfortunately, teams also scored 35 touchdowns against their defense (tenth in the conference). All in all, the Cowboys record based on their offensive touchdowns scored and offensive touchdowns allowed was 4-4. And lo and behold, that was their record. Of course, this is just one cherry picked example. the Adjusted Pythagorean Theorem rarely hits the nail directly on the head. However, it does usually correctly predict a team's record within one game of their actual record. Since 2007, the Adjusted Pythagorean Theorem predicted each team's conference record within one game for nearly two-thirds (386 of 582 team seasons or 66.3%) of all teams. So if the Adjusted Pythagorean Theorem does a pretty good job of predicting a teams record based solely on how many offensive touchdowns they scored and allowed, what happened to those teams that significantly over or underperformed their APR? I thought you might ask that. To answer that question, I looked at all teams from 2007-2010 with a conference record at least one and a half games different (either better or worse) than their record as predicted by the Adjusted Pythagorean Theorem. I then looked at how they did in conference play the following season. And now I will share with you the results. As with the previous two blog entries, I have separated BCS and non-BCS conference teams to see if there appear to be any differences. First off, the BCS conference teams that exceeded their APR.
Of the 15 teams that exceeded their APR in conference, 13 declined the following season. One team stayed the same, and only Oregon State circa 2007 improved. Many of the declines were significant. 11 of the 15 teams declined by at least two games in conference play, and some (Texas, Auburn, and Cincinnati) totally fell off a cliff. On average, these teams declined by 2.27 games in conference play the following season.

Now the BCS conference teams that underperformed their APR.
Of the 20 teams that underperformed their APR in conference, 13 improved the following season. Three stayed the same and four finished with worse conference records. Overall, the teams improved by just a shade over one game (1.025) in conference play the following season.

Now the non-BCS conference teams that exceeded their APR.
Of the 15 teams that exceeded their APR in conference, 12 declined the following season. One team stayed the same and two improved. Overall, these teams decline by 1.8 games in conference play the following season.

Now the non-BCS conference teams that underperformed their APR.
Of the 14 teams that underperformed their APR in conference, 11 improved the following season. Two stayed the same and only one team (New Mexico circa 2008) declined. Overall, the teams improved by nearly two games (1.964) in conference play the following season.

So now the next question on your mind should be: Who under and over-performed their APR in 2011? Eight BCS conference teams exceeded their APR in conference play. In the ACC, Virginia allowed more offensive touchdowns than they scored, yet managed a 5-3 ACC record. Mike London may find it hard to take the Cavaliers to back-to-back bowl games for the first time since Al Groh did it in 2004 and 2005. In the SEC, Auburn allowed 10 more offensive touchdowns (27) than they scored (17), yet still somehow managed to win half their league games! With Texas A&M joining the SEC West and Clemson on the non-conference schedule, the Tigers could miss the postseason altogether in 2012. In the Big 12, Kansas State allowed more offensive touchdowns than they scored yet managed a 7-2 conference record, finishing all alone in second place. A reversal of fortune is almost certainly in store in 2012. The Big 10 had three teams drastically exceed their APR. Penn State won six Big 10 games and was in contention until the final weekend of the regular season. However, the Lions allowed more offensive touchdowns than they scored and will be breaking in a new coach for the first time since 1965. Michigan State won seven conference games and nearly earned their first Rose Bowl bid since 1987. However, based on APR, the Spartans should have only won a shade over five league games. Nebraska underachieved all season and actually allowed more offensive touchdowns than they scored. That should make Michigan the favorite in the Legends Division in 2012. UCLA 'won' their division in the Pac-12 despite allowing more offensive touchdowns than they scored. Jim Mora may be in for a long season during his first year at the helm. And finally, Louisville was a surprise co-Big East champ in Charlie Strong's second season. However, the Cardinals allowed more offensive touchdowns than they scored (sensing a theme?), so even with West Virginia out of the picture, a BCS bid is still likely a pipe dream.

Six BCS conference teams significantly underperformed their APR in conference play. Miami scored more offensive touchdowns than they allowed, yet finished with a losing record in the ACC. Perhaps Al Golden can coax a solid showing out of this under-performing group. North Carolina also scored more touchdowns than they allowed in league play, yet finished with a losing record. Larry Fedora steps into a pretty good situation assuming the NCAA investigation has run its course. In the SEC, Vanderbilt showed some moxie and was much better than their 2-6 SEC record. Could James Franklin take then to consecutive bowls for the first time ever? Texas A&M was expected to be a contender during their last run through the Big 12. A plethora of second-half collapses caused the Aggies to finish 4-5 despite scoring seven more touchdowns than they allowed. They move to an insanely tough division and must contend with Alabama, Arkansas, and LSU, but could position themselves in the middle of the division. South Florida lost seven of eight after a 4-0 start and finished tied for last in the Big East. No one would be shocked if the Bulls went from worst to first. Syracuse also drastically underperformed their expected Big East record. Syracuse probably won't be winning the league in 2012, but a return to the postseason is likely.

Five non-BCS conference teams exceed their APR in conference play. Marshall finished 5-3 in Conference USA despite allowing more offensive touchdowns than they scored. The Herd will find returning to the postseason quite challenging in 2012. UAB won three games in Conference USA despite allowing twice as many offensive touchdowns as they scored (those teams typically only win about one game). Despite the relative good fortune, the coach was still canned. New coach Garrick McGee has his work cut out for him. Northern Illinois won the MAC Championship despite posting the profile of a solid, but hardly elite MAC team. Dave Doeren deserves credit for leading the Huskies to the summit in his first season, but a repeat is highly unlikely. Arkansas State finished unbeaten in the Sun Belt and got coach Hugh Freeze a job with Ole Miss. New coach Gus Malzahn may yet make the Redwolves into a Boise State-like power, but there is likely to be some regression in his first season. And speaking of Sun Belt powers, Louisiana-Lafayette also significantly exceeded their expected Sun Belt record. A second straight bowl appearance would likely have coach Mark Hudspeth in line for some big time jobs.

Four non-BCS conference teams significantly underperformed relative to their APR in conference play. UCF followed up their top-25 final ranking in 2010 with a losing season in 2011. They'll be back at or near the top of the league in 2012. Miami of Ohio followed up their MAC Championship in 2010 with a losing season in 2011. With Temple gone to the Big East in 2012, the MAC East is wide open. Air Force scored more offensive touchdowns than they allowed, yet finished with a losing record in the Mountain West. The Falcons could be poised to take flight in 2012. And finally, Louisiana-Monroe scored more offensive touchdowns than they allowed in the Sun Belt, but finished just 3-5 in the league. With some breaks, they could overtake their in-state brethren and get to a bowl.